Carrier Global Today
$60.89 -2.27 (-3.60%) As of 01:43 PM Eastern
This is a fair market value price provided by Massive. Learn more. - 52-Week Range
- $50.24
▼
$76.76 - Dividend Yield
- 1.58%
- P/E Ratio
- 40.06
- Price Target
- $73.51
Carrier Global Corp. NYSE: CARR is up 20% in 2026, but it’s hardly been a smooth ride for shareholders. Over the last 12 months, CARR is down more than 20%. It also dropped 9% on the day of its Q2 2026 earnings report.
The company is best known for providing residential and commercial heating and cooling systems. Continued softness in the housing market is unlikely to change in 2026. But the volatility, both good and bad, stems from the company’s growing role in the AI infrastructure trade.
The power needed to operate data centers has put energy stocks in focus. That power generates heat, requiring efficient, 24/7 heating and cooling solutions.
Carrier is not the only name in this space, which includes companies like Vertiv Holdings NYSE: VRT. However, as the company’s Q2 2026 earnings report makes clear, the data center pie is big enough for many companies to have a slice.
Carrier Earnings Beat, But Margin Pressure Weighs on CARR Stock
Carrier beat expectations on both revenue and earnings, with revenue rising 3.9% year over year. That makes the stock price drop confusing at first glance, since management also raised full-year guidance.
The disconnect comes down to the current quarter. Adjusted earnings per share (EPS) came in at 86 cents, down 7% year-over-year. Adjusted operating margin compressed 190 basis points to 17.2%. Free cash flow, however, jumped to $810 million from $568 million a year ago.
Margin pressure is the real story here. Management pointed to an unfavorable mix and rising input costs that offset pricing gains. That's not what investors want to see from a stock trading at growth-stock multiples, even with the top line accelerating.
Data Center Demand Continues to Drive Carrier's Growth
The bull case for Carrier increasingly runs through its data center business. Total orders were up roughly 40% year-over-year in Q2. Data center orders alone were up more than 300%.
Backlog now exceeds $8 billion, up about 40% year-over-year and 20% sequentially. Management raised full-year data center sales guidance to roughly $2 billion, up from a prior $1.5 billion estimate.
Carrier is also expanding manufacturing and lab capacity in the U.S. and India to keep pace with demand. That's a signal management expects this trend to extend well past 2026, not just capture a temporary AI infrastructure wave.
The company’s Residential business is showing signs of life as well. Second-quarter sales rose in the high single-digits, better than expected, with field inventory down about 25% year-over-year. Management now expects full-year residential sales growth, reversing a prior guide that called for a decline.
Carrier Raises Full-Year Guidance Despite Regional Challenges
Carrier now expects full-year 2026 sales of about $23 billion, up from a prior $22 billion guide. Adjusted EPS guidance rose to about $2.90 from $2.80. Free cash flow guidance held steady at roughly $2 billion.
Not every region is contributing equally. Segment margin guidance for Asia Pacific, the Middle East, and Africa was cut by roughly 200 basis points, worse than the prior guide. Management cited pressure in China and lower joint venture income tied to the Middle East conflict.
That regional split matters for anyone building a thesis here. The AI infrastructure story is largely an Americas and Europe phenomenon for Carrier right now, not a global one.
CARR: Key Support Comes Into Focus
The technical picture backs up the story of a volatile, sentiment-driven stock. CARR ran from around $68 in April to a 52-week high near $76 by early July.
The stock has since given back most of that rally. Shares closed just over $63 on July 28, below the 200-day moving average of $60.83. That average has been roughly flat for months, reflecting a stock stuck in a wide trading range for most of the past year.
The MACD indicator turned negative heading into earnings, with the signal line crossing below the MACD line in early July. That's a bearish momentum signal that preceded the post-earnings sell-off, for anyone tracking technicals alongside the fundamentals.
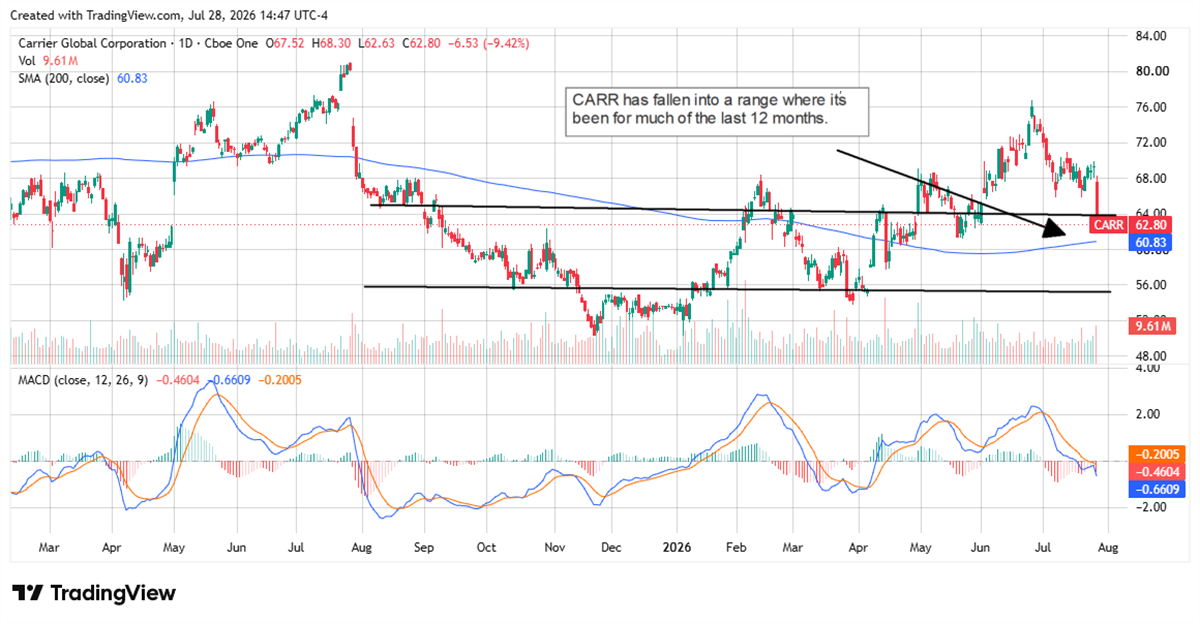
The $56 to $64 zone acted as a consolidation range from August through January. With shares now back near $63, that old range could act as support. A breakdown below $60, the 200-day average, would be the next level worth watching.
Is CARR a Buy After the Post-Earnings Sell-Off?
CARR trades around 42x earnings, which puts it more in the domain of technology stocks. That's one reason why the stock has made 10 moves of over 5% in the last 12 months. Carrier is now part of the AI infrastructure trade, which is a long-term tailwind that may butt up against regulatory headwinds in the short term.
The data center buildout is helping Carrier navigate a challenging new construction market. It’s not a stock you want to overpay for, but at 23x forward earnings, Carrier may not be as overpriced as it seems.
The consensus price target for CARR is $73.51, implying an upside of over 17% with several analysts offering even higher targets. While investors wait for that growth, they receive a dividend payout well supported by current cash flow.
With free cash flow up 43% year-over-year in Q2, that dividend support looks intact even after a rough earnings reaction.
Before you consider Carrier Global, you'll want to hear this.
MarketBeat keeps track of Wall Street's top-rated and best performing research analysts and the stocks they recommend to their clients on a daily basis. MarketBeat has identified the five stocks that top analysts are quietly whispering to their clients to buy now before the broader market catches on... and Carrier Global wasn't on the list.
While Carrier Global currently has a Moderate Buy rating among analysts, top-rated analysts believe these five stocks are better buys.
View The Five Stocks Here
Discover the 10 Best High-Yield Dividend Stocks for 2026 and secure reliable income in uncertain markets. Download the report now to identify top dividend payers and avoid common yield traps.
Get This Free Report
