If day trading feels too fast-paced for you and long-term investing ties up your capital for longer than you'd like, swing trading might be a suitable middle ground. This strategy combines the technical analysis techniques often used in day trading with the research and patience typically associated with long-term investing.
This article provides an in-depth exploration of swing trading, including the tools, methods, and strategies it involves, as well as its pros and cons. Whether you're a beginner or an experienced trader, you'll find clear, practical insights to set you up for swing trading success.
What Is Swing Trading?
Swing trading is a short- to medium-term trading strategy where traders seek to profit from price fluctuations or "swings" in stocks or other assets. Positions are typically held for a few days to a few weeks, and traders primarily use technical analysis to determine optimal entry and exit points.
For example, if you purchase a stock at $24 on Tuesday and sell it at $27 on Friday, you've made a swing trade, earning a $3 profit per share. However, outcomes can vary—if the stock dropped to $21 by Friday, you'd face a $3 per share loss. The key lies in the methods used to decide when to enter at $24 and exit at $27. Swing trading carries inherent risks.
Characteristics of Swing Trading
Swing trading can offer a balanced approach for those looking to actively engage in the market without the intense demands of day trading or the patience required for long-term investing. However, success depends on careful analysis, disciplined execution, and managing risks effectively.
- Activity Level: Swing trading is more active than investing but less so than day trading.
- Holding Period: Positions are typically held overnight and may span days or weeks, exposing traders to overnight or weekend risks, such as unexpected events that cause price gaps when markets reopen.
- Premeditation: Swing trading requires a clear strategy. It’s not simply holding a position longer than planned. For instance, a day trade should only turn into a swing trade if there’s a valid reason, such as a favorable trend or pattern—not because of an unwillingness to accept a loss.
How Does Swing Trading Work?
Traders identify opportunities using technical analysis, such as chart patterns, trend lines, and indicators like moving averages or the Relative Strength Index (RSI), to predict potential price movements. They often target "swings" in the market, which are price reversals or continuations, entering trades at optimal points to capture these movements.
The goal of swing trading is to capitalize on short-term trends while minimizing risks by setting stop-loss and take-profit levels. Unlike day trading, swing trading doesn’t require constant monitoring during market hours, making it accessible to those who can dedicate time to analysis but not to real-time trading. Also unlike day trading, which involves closing all positions by the end of the trading day, swing trading allows positions to remain open overnight, capitalizing on trends that take time to develop.
Swing trading requires discipline, a well-defined strategy, and an understanding of market volatility. For many traders, knowing a company's fundamentals by studying earnings reports, researching analyst upgrades and downgrades and listening to conference call transcripts, helps them hold positions overnight. For this reason, blue-chip and dividend stocks are commonly included in swing trades since they tend to be more fundamentally sound than penny stocks. Being in a hot sector or industry or theme like artificial intelligence (AI) or quantum computing can also help traders hold swing trades.
To manage risk, traders often use smaller position sizes than they might day trading. For example:
- A day trader might trade 1,000 shares of a $50 stock for a $0.50 profit intraday ($500 gain).
- A swing trader could trade 200 shares of the same stock for a $2.50 profit over several days ($500 gain).
Swing Trading Methods
Swing trading utilizes many different methods that day traders commonly use. Mechanically, it's like day trading but with wider time frames and price ranges. Here are some swing trading methods to consider applying to your trades. The time frame charts commonly used for swing trades range from 60 minutes daily, weekly and monthly. Many traders use a combination of the following methods as part of a trading methodology or system using the best indicators for swing trading.
Bullish or Bearish Crossover Points
Crossover signals can be used with different chart indicators. The most common is the moving average (MA) crossovers that indicate a reversal breakout or breakdown. Utilizing the 50-period and 200-period moving averages enables you to trade golden cross breakouts (signaling a potential upward breakout) and death cross breakdowns (signaling a potential downward breakout).
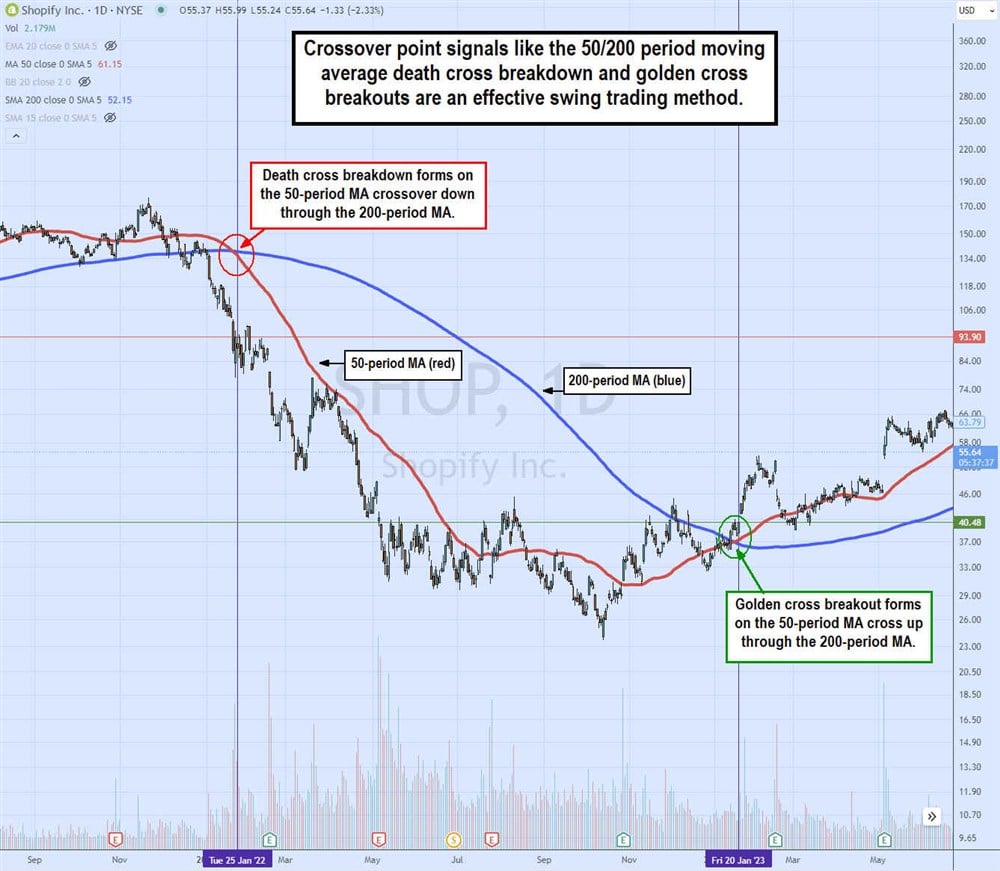
The daily chart for the e-commerce platform Shopify Inc. NASDAQ: SHOP illustrates the alternating nature of crossover point trigger patterns. The bearish death cross breakdown occurs on January 25, 2022, on the daily 50-period MA crossover down through the 200-period MA, triggering at $93.90 as it sinks to a low of $23.60 by October 13, 2022. The bullish golden cross pattern forms on January 20, 2023, on the 50-period MA crossover up through the 200-period MA, triggering at $40.48 as it climbs to a high of $70.50 on July 15, 2023.
Support and Resistance Levels
By analyzing longer periods on a candlestick chart, you can identify and use horizontal trend lines to mark significant resistance top and support bottom levels. A resistance top forms when the stock price peaks at a price level and falls back down. When a new high forms, a new top should be drawn; it should also be drawn on lower tops. The same applies to support bottoms.
These support and resistance triggers can be played as stop-loss, break, or target price levels, depending on your trade. For example, if you buy XYZ stock long at $27 and the resistance top at $30, you can use that as a profit price target. If you short sell XYZ at $29, you might use the $30 level as a stop-loss trigger. If XYZ breaks out through the $30 resistance, it can transform into a new support level at $30.
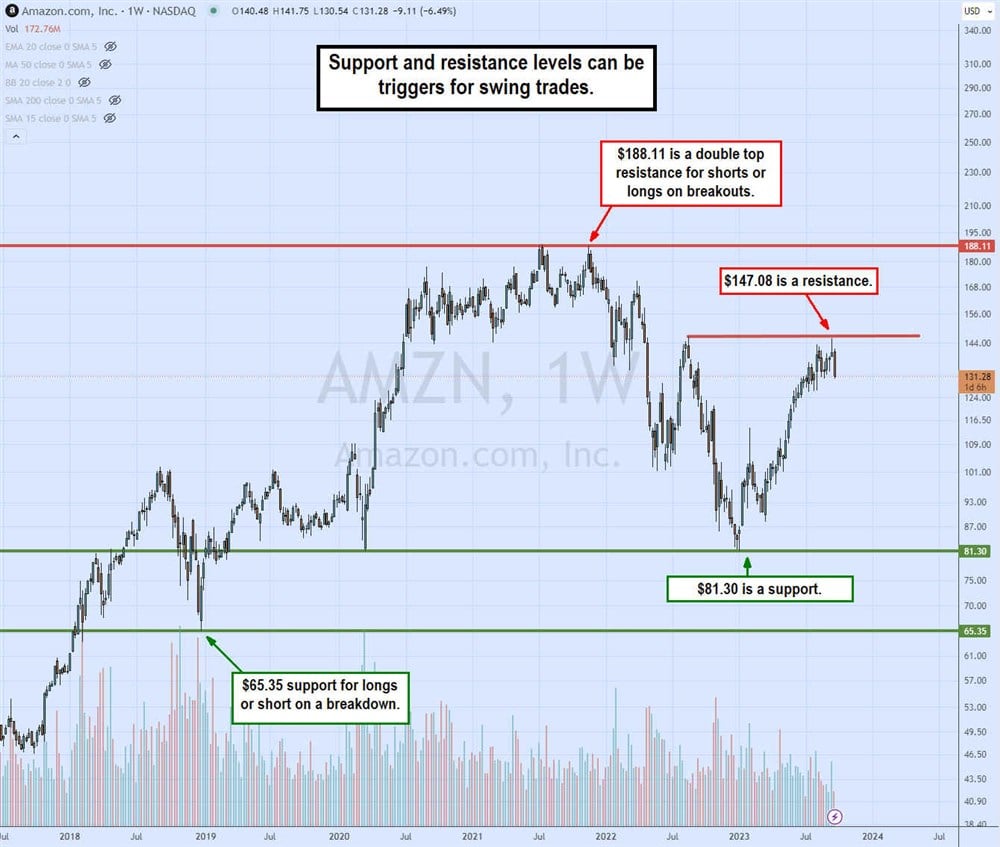
On the weekly Amazon.com Inc. NASDAQ: AMZN chart, very distinct tops are marked by red horizontal resistance trend lines. There are horizontal support lines in the market with horizontal support trendlines. The $188.11 is a resistance double top. If it retests this level, this can be a signal to short-sell AMZN. If the stock breaks higher, it can be a signal to go long. The same applies to the $147.08 resistance. The $65.35 is a support level bottom to consider taking long for a bounce or a short on a breakdown lower. The $81.30 is a double bottom support level for longs or a short on breakdowns.
MACD Crossovers
Using a momentum indicator helps to time your entries and exits. The Moving Average Convergence Divergence (MACD) comprises two exponential moving averages (EMAs), a lead MACD line with a 9 EMA, and the laggard signal line smooths with a 26 EMA. When the lead MA crosses up through the laggard, it is often considered a buy signal. When the lead MA crossover falls through the laggard, it is often used as a short-sell signal. The histogram illustrates the distance between the MACD and signal line and can help confirm the crossover when the histogram goes from green to red and red to green.
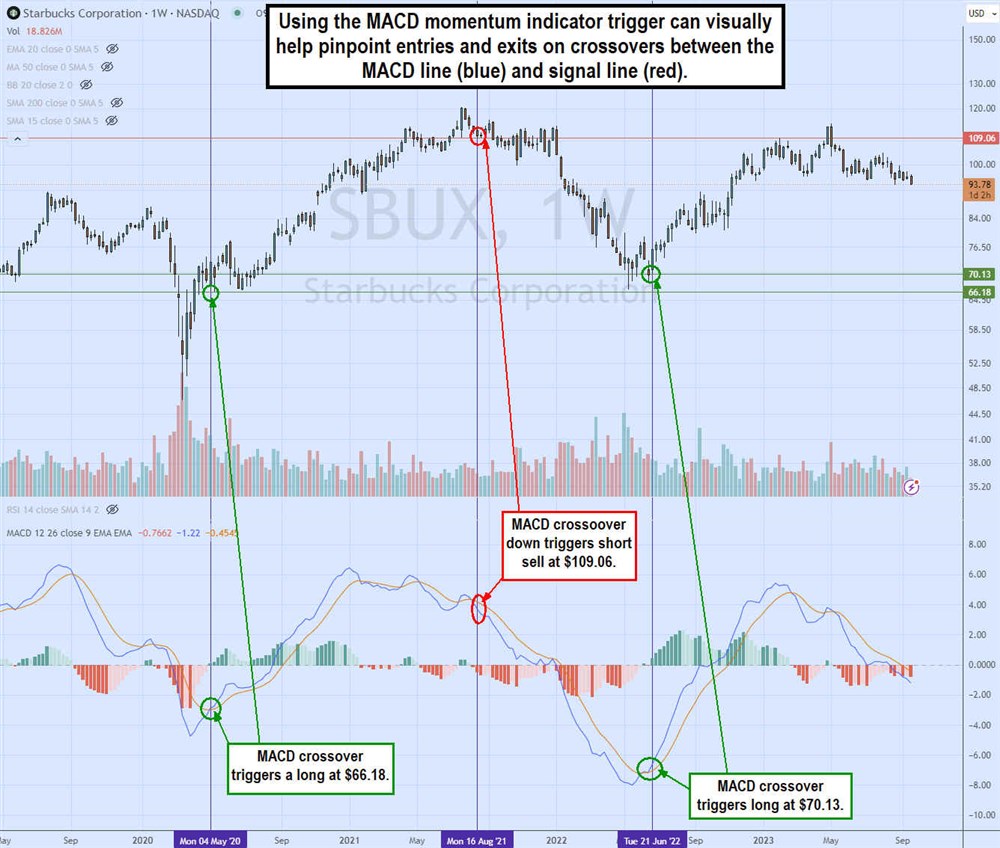 The weekly Starbucks Co. NASDAQ: SBUX candlestick chart illustrates the MACD crossovers for long and short entries. The MACD crossover up triggers along at $66.18 on May 4, 2022. The MACD crossover down triggered a short sell at $109.06 on August 12, 2021. The MACD crossover triggers a long $70.13 on June 21, 2022.
Fibonacci Retracement Pattern
This pattern uses a price indicator called the Fibonacci levels (fibs). Fib levels are created by plotting a starting and ending point consisting of a swing low to a swing high and back down from the swing high to the swing low. Fib ratios are applied to the distance popularly using 0.25 or 25%, 0.32 or 32%, 0.50 or 50%, 0.618 or 61.8%, 0.78 or 78% and 0.886. The 0.618 fib or its inverse, which is 0.382, tends to be levels of most interest. Each of the fib levels are treated as potential support and resistance levels. These static price levels change when the fibs are replotted with new swing lows or swing highs. A fib level can be played long if it holds support and bounces or short if it acts as a resistance.
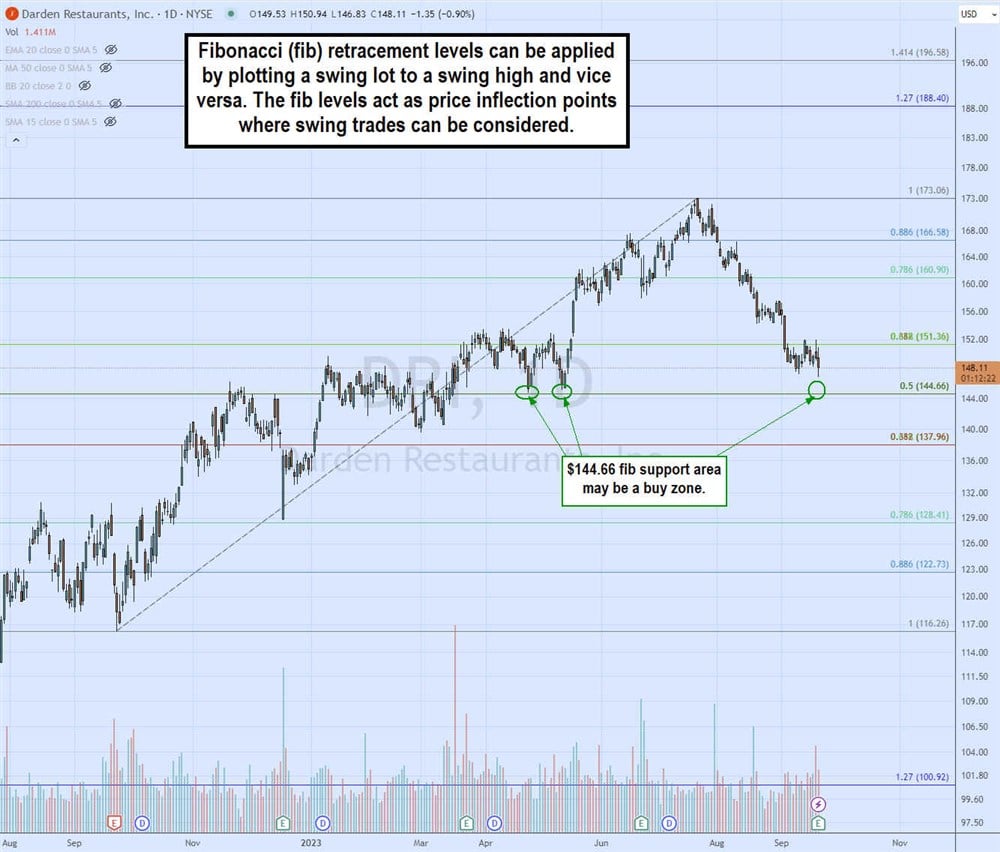 The daily candlestick chart of Darden Restaurants Inc. (NYSE: DRI) fib lines were plotted using a swing low of $116.26 and a swing high of $173.06. Some fib levels act as key price inflection points that can trigger a swing trade depending on how the price reacts. The 0.50 fib level at $144.66 has proven to be a support level on its last two pullbacks, which sets it up for a possible buy zone if it retests again. A stop-loss would be underneath if it forms a breakdown, turning it into a resistance level.
Day Trading vs Swing Trading
While day trading offers quick profits, swing trading appeals to those who cannot monitor markets constantly. It avoids much of the intraday "noise" and provides more flexibility in terms of time commitment and strategy. However, it requires patience, discipline, and the ability to endure larger price swings.
| Feature |
Day Trading |
Swing Trading |
| Holding Period |
Intraday (positions closed daily) |
Days to weeks |
| Position Size |
Larger due to leverage |
Smaller to accommodate wider stop-loss |
| Risk |
Smaller stop-loss, quick adjustments |
Larger stop-loss, greater price swings |
| Time Commitment |
Requires constant monitoring |
Less screen time needed |
Swing Trading Pros and Cons
Let's look at the benefits of swing trading:
- High Profit Potential: Positions can run for days/weeks, maximizing gains.
- Flexibility: No need to close positions daily.
- Less Screen Time: Suitable for part-time traders.
Here are some of the pitfalls of swing trading:
- Overnight Risk: Vulnerable to events outside trading hours.
- Speculative Nature: Requires strict discipline with stop-losses.
- Wider Stop Losses: Larger price ranges demand smaller position sizes.
Avoid Impulsive Decisions to Achieve Swing Trading Success
Swing trading requires a balance of technical skill, discipline, and patience. Too often, a day trade may go red, and the trader decides to hold it overnight and swing trade it until it bounces back to green. Too often, the result is a deeper shade of red as the stock continues to plummet lower until the pain is too much, and a stop loss is executed. Or the trader may still be holding the trade as a bag holder convinced not to sell the stock for a loss.
The bottom line is to honor your stop losses if they trigger and reassess when you're back in a cash position. With proper planning and risk management, it can be a powerful strategy for capturing market trends.
Before you consider Amazon.com, you'll want to hear this.
MarketBeat keeps track of Wall Street's top-rated and best performing research analysts and the stocks they recommend to their clients on a daily basis. MarketBeat has identified the five stocks that top analysts are quietly whispering to their clients to buy now before the broader market catches on... and Amazon.com wasn't on the list.
While Amazon.com currently has a Moderate Buy rating among analysts, top-rated analysts believe these five stocks are better buys.
View The Five Stocks Here
Nuclear energy is entering a new growth cycle as rising power demand, expanding data centers, and renewed policy support bring the sector back into focus. After strong gains in recent years, the most impactful phase of nuclear investment may still be ahead.
This report highlights seven nuclear energy stocks positioned across the value chain—combining near-term revenue with long-term upside as next-generation technologies scale. Click the link below to unlock the full list.
Get This Free Report
Like this article? Share it with a colleague.
Link copied to clipboard.