Real estate investing offers a unique combination of potential financial rewards and long-term stability. Let's take some time to discuss valuable insights and practical advice on how to get started in real estate, empowering you to make informed investment decisions.
Before we dive into the diverse range of real estate investments, let's address the fundamental question: How to start in real estate investing? We will explore step-by-step strategies, share tips for beginners and highlight where to start investing in real estate for optimal results.
How Real Estate Makes Money
Real estate investment offers various avenues for individuals to generate income and build wealth. Whether you're a beginner looking to start investing in real estate or someone interested in diversifying their investment portfolio, learning how to invest in real estate is essential, and there are several ways to participate in this lucrative market.
One of the most common methods real estate investors utilize is physical property ownership. As a real estate investor, you can purchase residential, commercial, or industrial properties to generate rental income and benefit from property appreciation over time. This approach requires careful research, property management and understanding local market conditions.
A great place to learn real estate investing for beginners is to research real estate investment trusts (REITs). For those seeking a more accessible entry point, REITs provide an opportunity to invest in real estate without direct property ownership. REITs are companies that own, operate or finance income-generating real estate properties.
By investing in REITs, individuals can become shareholders and earn dividends from the rental income and property sales of the underlying real estate assets. If REITs interest you, look for companies like Goldman Sachs Asset Management division for multiple real estate investment opportunities.
Another avenue is investing in mortgage-backed securities (MBS). These securities represent ownership in a pool of mortgage loans.
When individuals or institutions obtain mortgages to purchase properties, these loans are often bundled together and sold as MBS to investors. Individuals can earn income from the interest and principal payments made by borrowers.
Real estate-related stocks offer another opportunity for investors. These stocks belong to companies involved in various aspects of the real estate industry, such as property development, construction, management or real estate services. Real estate-related stock investment can expose investors to companies ranging from penny stocks to blue-chip companies. By investing in these stocks, individuals can benefit from the growth and profitability of these companies and the broader real estate sector. Investing in stocks also provides you the option to make dividends. Finding the best dividend stocks will help your portfolio grow faster.
Bonds are also an option for investing in real estate. Real estate bonds issued by companies, developers or municipalities allow investors to lend money for real estate projects in exchange for regular interest payments. At maturity, the principal amount goes back to the bondholders.
Another great place to learn real estate for beginners is exchange-traded funds (ETFs). ETFs focused on real estate provide an additional investment avenue because these funds comprise a diversified portfolio of real estate-related assets and trade on stock exchanges. By investing in real estate ETFs, individuals can gain exposure to a broad range of real estate investments, including REITs and real estate stocks, without needing individual security selection.
By investing in real estate, whether through physical property ownership, REITs, MBS, real estate-related stocks, bonds or ETFs, individuals can generate income, benefit from property appreciation and diversify their investment portfolios.
Reasons to Invest in Real Estate
Real estate investment offers many benefits and opportunities, making it an attractive option for beginners and seasoned investors. Whether you're looking to generate passive income, build long-term wealth or diversify your investment portfolio, real estate provides several compelling reasons to consider investing.
Steady Cash Flow
Real estate investments, such as rental properties, can provide a steady stream of rental income, offering a reliable source of cash flow. This income can help cover mortgage payments and property maintenance costs. Some properties even generate profit. Real estate-related ETFs that pay dividends are also a great option if you are looking for steady cash flow.
Appreciation Potential
Physical real estate property has the potential to appreciate over time. Historically, real estate prices have tended to increase, allowing investors to benefit from capital appreciation, which can lead to significant returns on investment when properties are sold. Organizations like the National Association of Realtors provide research and statistics to help you understand the appreciation potential in your area.
Leverage
Real estate investments offer the opportunity to use leverage, meaning you can purchase properties with borrowed money. You can control a valuable asset with a smaller upfront investment. Leveraging can amplify your returns when property values rise.
Portfolio Diversification
Investing in real estate and related securities can provide diversification benefits to your investment portfolio. Real estate often exhibits a low correlation with traditional assets, helping to reduce overall portfolio risk.
Tax Advantages
Real estate investors can take advantage of various tax benefits, including deductions for mortgage interest, property taxes, depreciation and operating expenses. These deductions can lower your taxable income and increase your after-tax returns.
Inflation Hedge
Real estate investments have the potential to serve as a hedge against inflation. As inflation increases, rental income and property values usually rise, allowing real estate investors to preserve and potentially increase their purchasing power.
Control and Tangible Asset
Unlike other investments, real estate provides investors with a tangible asset they can see, touch and control. This sense of ownership can be appealing and give a sense of security.
Potential for Passive Income
Real estate investments offer opportunities for passive income. Rental properties, for example, can generate ongoing rental income, allowing you to earn money while minimizing active involvement. Learning how to choose the best dividend-paying real estate stocks is another way to generate passive income.
Long-Term Wealth Building
Real estate investments have the potential for long-term wealth accumulation. Over time, investors can build equity and accumulate substantial wealth as property values appreciate and mortgages get paid down.
Flexibility in Investment Options
Real estate investing offers a range of investment options to suit different preferences and risk appetites. You can invest in physical properties, REITs, MBS, real estate-related stocks, exchange-traded funds (ETFs) and more.
Real estate investing offers numerous advantages for investors. After discussing the benefits of real estate investing, it is important to discuss strategies for beginners to consider when embarking on real estate. By familiarizing ourselves with these practical approaches and techniques, investors can gain valuable insights into how to invest in real estate effectively.
How to Invest in Real Estate for Beginners: Strategies to Consider
For beginners, navigating the world of real estate investing may seem daunting at first. Still, the right strategies and knowledge can lead to financial growth and wealth accumulation.
Let's explore strategies investors can consider when venturing into real estate investment.
These strategies will provide a solid foundation and guide investors toward making informed decisions in their investment journey. Whether you're looking to invest in physical properties, REITs or other real estate-related options, these strategies will help you navigate the nuances of the real estate market and set you on the path to success.
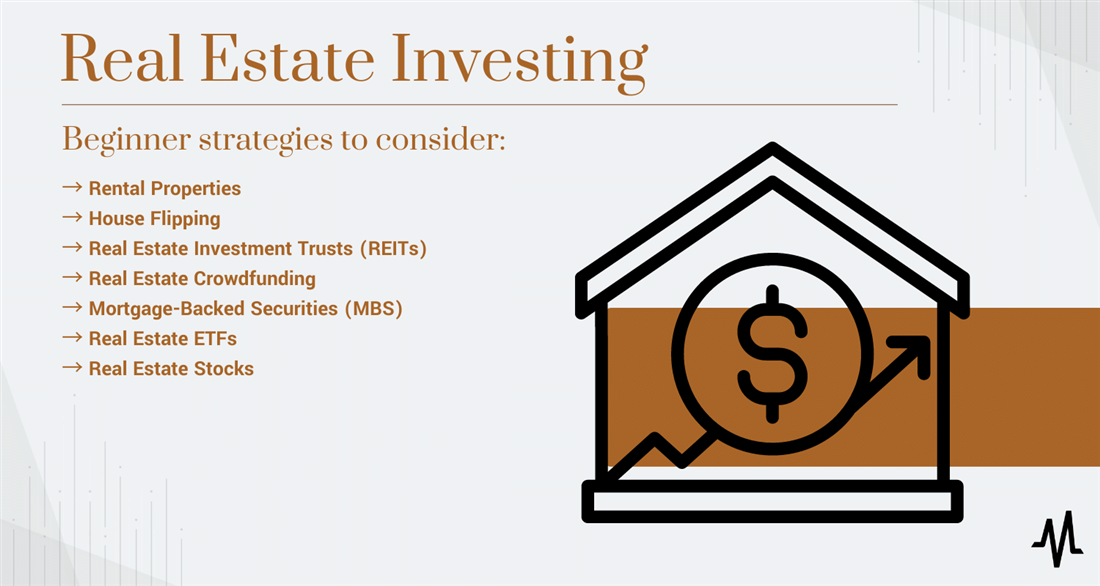
Rental Properties
Investing in rental properties involves purchasing residential or commercial properties to rent out to tenants. This strategy allows you to generate rental income, providing a steady cash flow and potential long-term appreciation. As a landlord, you are responsible for property management, tenant screening and maintenance. It's important to carefully analyze rental markets, property expenses and potential rental income to ensure positive cash flow and a favorable return on investment.
House Flipping
House flipping involves purchasing properties that require renovation or repair, making the necessary improvements and selling them quickly for a profit. This strategy requires careful analysis of market trends, property values and renovation costs. House flipping can be a high-risk, high-reward strategy, as success depends on accurately estimating costs, managing renovations efficiently and selling the property at a higher price.
Real Estate Investment Trusts (REITs)
REITs are companies that own, operate or finance income-generating real estate. By investing in REITs, you can gain exposure to a diversified portfolio of properties without directly owning them. REITs typically pay dividends to shareholders based on the rental income their properties generate. This strategy offers a convenient and accessible way to invest in real estate with lower capital requirements and greater liquidity.
Real Estate Crowdfunding
Crowdfunding platforms allow investors to pool their funds for various real estate projects. You can invest in properties such as residential complexes, commercial buildings or development projects through these platforms. Real estate crowdfunding allows diversifying your investments across different properties and locations while accessing deals traditionally available only to institutional investors.
Mortgage-Backed Securities (MBS)
MBS are investment products representing an ownership interest in a pool of mortgages. When investing in MBS, you invest in the underlying mortgages and receive some of the borrowers' interest payments. Mortgage-backed securities offer a way to invest indirectly in real estate and benefit from the interest income generated by mortgage payments.
Real Estate ETFs
Real estate ETFs focus on real estate that provides investors with a diversified portfolio of real estate-related assets. These ETFs typically hold shares of REITs, real estate development companies or other real estate-related securities.
Real estate ETFs offer flexibility, liquidity and the opportunity to invest in the broader real estate market with a single investment. For instance, if you are only interested in investing in farm-related real estate, an ETF can help you reach that goal.
Real Estate Stocks
Another strategy to consider is investing in publicly traded companies in the real estate sector. These companies may include real estate developers, property management firms, home builders or companies involved in real estate services. By investing in real estate stocks, you can gain exposure to the real estate market and benefit from the growth and profitability of these companies.
Each strategy offers unique opportunities and considerations for beginners investing in real estate. It's important to thoroughly research and understand the specifics of each strategy, assess your risk tolerance and align your investment goals with the chosen approach.
Real Estate Mistakes to Avoid
When investing in real estate, it's essential to approach the market with knowledge and caution to avoid common pitfalls that can hinder your success. Real estate can be a lucrative investment but carries inherent risks and challenges. Understanding the potential mistakes and how to avoid them can help you navigate the real estate landscape more effectively. Let's take a few minutes to discuss some of the common real estate mistakes and provide guidance on how to avoid them.
- Lack of proper research and due diligence: One of the most critical mistakes is diving into an investment without thorough research. Failing to research the local market, property values, rental demand and potential risks can lead to poor investment decisions. Take the time to conduct market research, analyze comparable property prices, assess the rental market and thoroughly inspect the property before purchasing.
- Overextending financially: Stretching your financial limits by purchasing properties beyond your means can be a grave mistake. Create a realistic budget and stick to it. Consider all the costs associated with the investment, including property taxes, insurance, maintenance and potential vacancies. Avoid overextending yourself by investing in properties that align with your financial capabilities and long-term investment goals.
- Ignoring cash flow considerations: Positive cash flow is vital for a successful real estate investment. Failing to accurately estimate expenses, rental income and potential vacancies can lead to negative cash flow, making it difficult to sustain the investment. Ensure your rental income covers all expenses and leaves room for unexpected costs. Conduct a thorough analysis of the property's potential cash flow before committing to the investment.
- Neglecting property management: Proper property management is crucial for maintaining and maximizing your investment's value. Neglecting property management responsibilities or failing to hire competent professionals can lead to decreased property value, tenant dissatisfaction and increased turnover. Consider hiring a reliable property management company or educate yourself on effective property management practices to ensure the property is well-maintained and tenants are satisfied.
- Lack of diversification: Putting all your eggs in one basket by investing solely in one type of property or location can be risky. Real estate markets can fluctuate, and specific areas may experience downturns. Diversifying your real estate portfolio by investing in different types of properties, locations and investment vehicles, such as REITs or real estate stocks, can help mitigate risks and increase your chances of overall success.
- Failing to have an exit strategy: It's essential to have a clear exit strategy in mind when entering a real estate investment. Unexpected circumstances or changes in personal circumstances may require you to sell the property earlier than planned. Not having an exit strategy can lead to potential financial losses or an inability to capitalize on profitable opportunities. Consider various exit strategies, such as selling, refinancing or leasing options and prepare to adapt to changing market conditions.
- Emotional decision-making: Allowing emotions to drive investment decisions can be detrimental. Approach real estate investing with a rational and objective mindset. Avoid getting attached to a property or making impulsive decisions based on personal preferences. Instead, focus on investment potential, financial feasibility and long-term prospects.
Understanding these common real estate mistakes and implementing strategies to avoid them can increase your chances of success in real estate investing. Remember to seek professional advice, continuously educate yourself and stay vigilant in monitoring your investments to make informed decisions and optimize your returns.
How to Fund Real Estate Investments
Funding real estate investments is a crucial aspect of building a successful portfolio. Whether you're investing in physical properties, REITs, mortgage-backed securities (MBS) or other real estate assets, understanding the various funding options available is essential.
Let's explore different ways to fund real estate investments, providing a comprehensive overview of the funding process for other asset types.
Utilizing personal savings is a common starting point for many real estate investors. You can accumulate funds to invest in real estate-related assets by saving up a portion of your income. This method allows for greater flexibility and control over your investments, as you don't rely on external financing.
When purchasing physical properties, obtaining a mortgage loan from a bank or financial institution is a prevalent funding method. With a traditional mortgage loan, you secure financing by making a down payment and repaying the loan over a fixed period with interest. This option suits investors looking to build equity and generate long-term returns through rental income or property appreciation.
REITs are investment vehicles that pool funds from multiple investors to purchase and manage income-generating properties. Investors can participate by purchasing publicly traded REIT shares or through non-traded REITs. Investing in REITs provides access to a diversified real estate portfolio without direct property ownership.
Mortgage-backed securities are financial instruments created by packaging together mortgage loans. Investors can purchase mortgage-backed securities through the secondary market, allowing them to invest in a pool of mortgages. These securities provide an opportunity to earn income through the interest payments made by homeowners on their mortgages.
Crowdfunding platforms have emerged as an alternative way to fund real estate investments. These platforms connect investors with real estate projects seeking funding. Investors can contribute capital to a specific property or portfolio and earn returns based on the project's performance.
Private equity funds pool capital from accredited investors to invest in real estate opportunities. Professional investment firms manage these funds and offer access to larger-scale projects that may not be available to individual investors. Private equity funds typically require higher minimum investments and have more extended lock-up periods.
Partnering with other investors or real estate developers is a way to share the financial burden and access more significant investment opportunities. Partnerships can take various forms, such as joint ventures or limited partnerships, where investors contribute capital and share in the profits and risks of the investment.
If you own a property, you can tap into its equity through a home equity loan or line of credit. This option allows you to leverage the value of your existing property to fund new investments. However, it's essential to consider the risks involved and ensure you can manage the additional debt.
Some financial institutions and private lenders offer specialized real estate investment loans. These loans are designed specifically for real estate investors and may have different terms and requirements than traditional mortgage loans.
Funding real estate investments involves a range of options, from personal savings and traditional mortgage loans to REITs, MBS, crowdfunding and partnerships. Each funding method has advantages and considerations, and the choice depends on your investment goals, risk tolerance and financial circumstances.
How to Buy Real Estate Stocks
Investing in real estate stocks allows individuals to gain exposure to the real estate market without directly owning physical properties. Real estate stocks are shares of publicly traded companies that own, develop, manage or finance real estate assets. These stocks represent ownership in real estate companies and can provide potential benefits such as diversification, liquidity and the opportunity to participate in the growth of the real estate sector.
- Research and choose a real estate stock: Research companies that align with your investment goals and preferences. Look for companies with a strong track record, diversified portfolios and solid financials. Research that company's financial history and consider reviewing its last earnings call.
- Select an investment platform: Choose a reputable online brokerage platform that offers access to real estate stocks. Ensure the platform provides a user-friendly interface, competitive pricing and access to the stock exchanges listing real estate stocks.
- Open an investment account: Sign up for an investment account with the chosen brokerage platform, which typically involves providing personal information, verifying your identity and funding your account.
- Conduct due diligence: Conduct thorough due diligence on the selected real estate stock before making investment decisions. Review the company's financial reports, performance history, management team, competitive position and any relevant news or events that may impact its prospects.
- Place a trade: Once you are ready to invest, use your brokerage platform to place a trade for the chosen real estate stock. Specify the number of shares you wish to purchase and the order type (e.g., market or limit order) to execute the trade.
- Monitor and manage your investment: Actively monitor your investment after buying real estate stocks. Stay informed about company updates, industry trends and market conditions. Keep watch on essential factors like interest rates. Real estate stocks tend to drop as interest rates rise. Consider setting price alerts or using stop-loss orders to manage your risk.
Real estate stocks can offer several advantages. They provide exposure to the real estate market, which historically has shown potential for long-term growth and income generation. Additionally, real estate stocks offer greater liquidity than physical properties, as they can be easily bought or sold on the stock exchange. Investors can also benefit from dividend payments, as many real estate companies distribute a portion of their earnings to shareholders.
Remember to thoroughly research and understand the fundamentals of the companies you're considering and carefully evaluate your investment objectives before buying real estate stocks.
Top Features to Look for in a Real Estate Investment
When investing in real estate stocks, having access to essential information and analytical tools is crucial for making informed decisions. A comprehensive understanding of the key features and resources available can significantly aid investors in evaluating real estate stocks and identifying opportunities. Let's explore various features to consider when assessing real estate stocks.
Understanding the significance of each feature will empower investors to conduct thorough analyses and make informed decisions in the dynamic world of real estate stock investing. Let's dive into the key features that play a pivotal role in evaluating real estate stocks.
Analyst Ratings
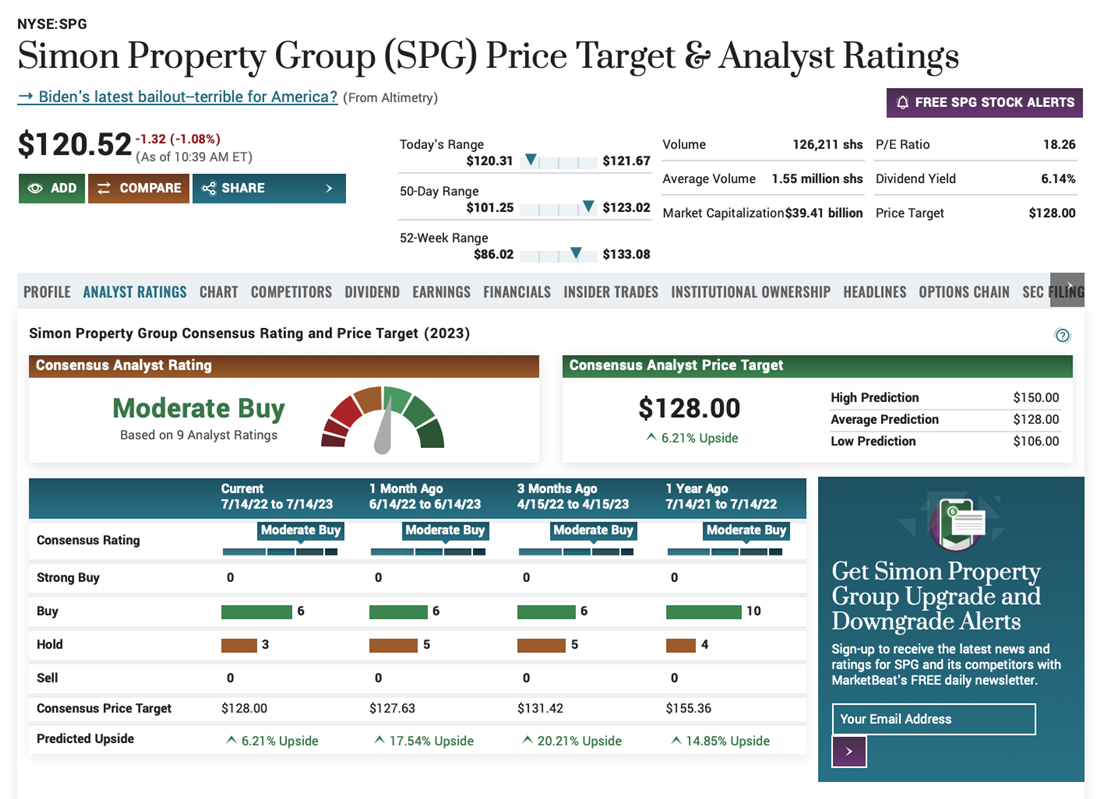
Analyst ratings provide insights into how experts and financial analysts view a particular real estate stock. These ratings are based on comprehensive research, industry knowledge and financial analysis. They can help investors gauge a real estate stock's overall sentiment and potential performance. Companies like Simon Property Group (NYSE: SPG) are large, complex and difficult for entry-level investors to gauge. Utilizing the analyst rating for Simon Property Group will help you understand how seasoned professionals see the company.
 Charts
Charts display the historical price movements and trends of a real estate stock. They allow investors to visualize the stock's performance over time, identify patterns and make informed decisions based on technical analysis. Reviewing the Prologis (NYSE: PLD) chart reveals the logistical real estate company's struggles during the pandemic years and the company's fight back to profitability after the pandemic.
Competitors
Understanding the competitive landscape is crucial in evaluating real estate stocks. Analyzing competitors provides insights into market dynamics, industry trends and real estate companies' relative strengths and weaknesses. This information helps investors assess a company's competitive positioning and growth prospects. Industries like cellphone and radio tower real estate are very niche, so learning about American Tower (NYSE: AMT) competitors could help you invest in American Towers or lead you to an unknown and more lucrative competitor.
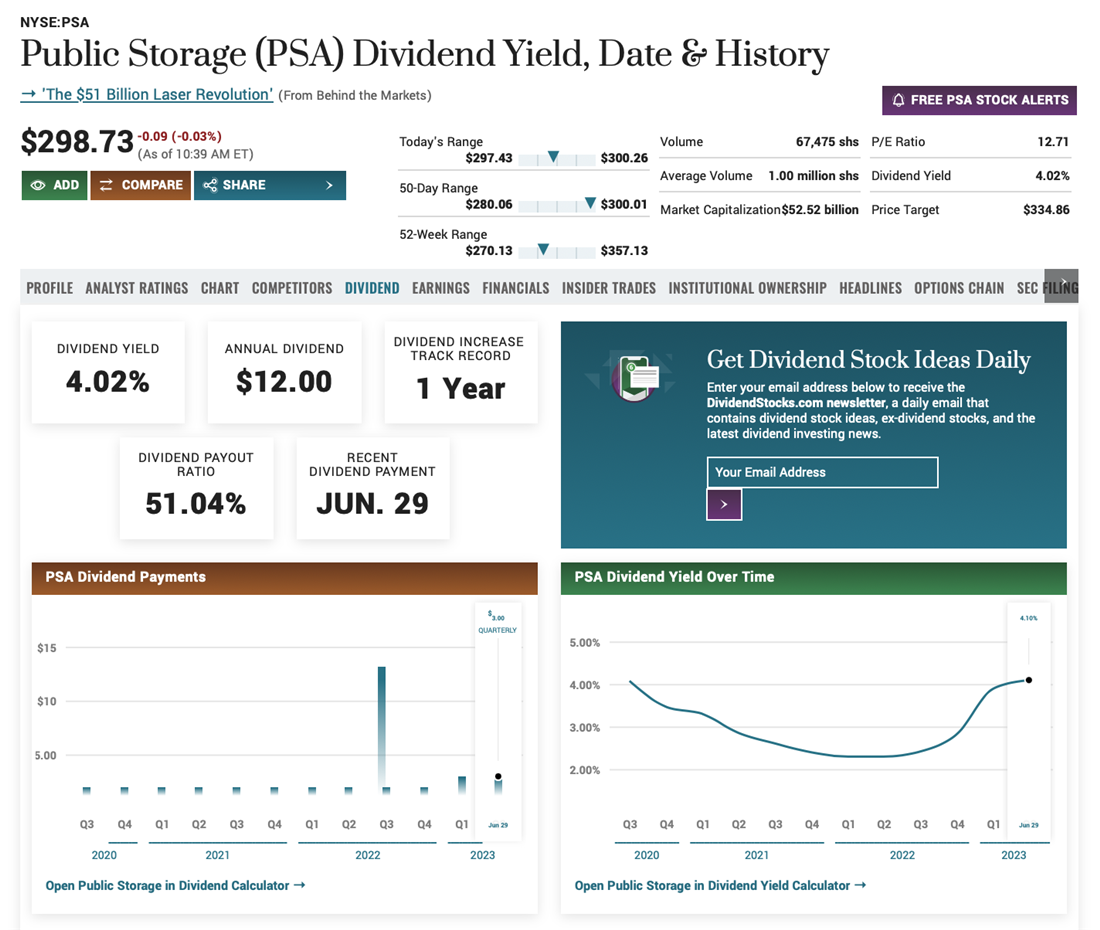
Dividend information is essential for income-oriented investors. Many real estate investment trusts (REITs), ETFs, and some stocks distribute a significant portion of their earnings to shareholders as dividends. Evaluating dividend history, yield and sustainability can be valuable when considering real estate stocks for income generation. For instance, Public Storage's (NYSE: PSA) dividend history shows solid dividend returns. Looking for high-yielding dividend stocks is a great way to generate passive income and grow your investment portfolio.
Insider Trades
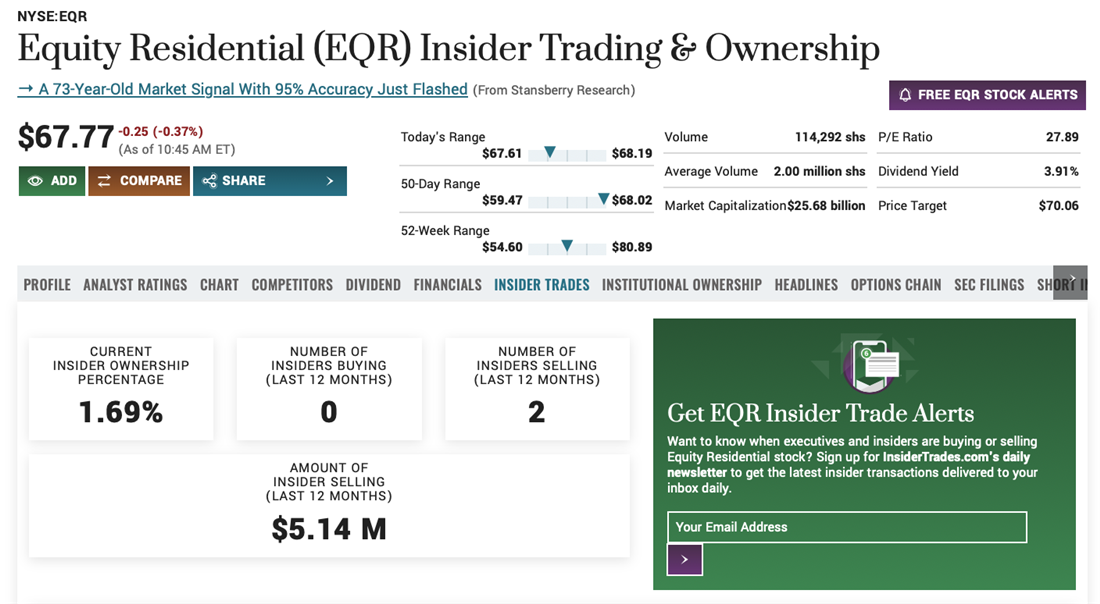
Monitoring insider trading activity can provide insights into the sentiments and actions of company insiders, such as executives and board members. Significant insider buying or selling can signal their confidence or concerns about the company's prospects, which may influence investors' decisions. Reviewing Equity Residential's (NYSE: EQR) insider trading history shows that there has been some substantial insider activity.
 Institutional Ownership
Examining the level of institutional ownership in a real estate stock reveals the confidence and interest of large institutional investors, such as mutual funds and pension funds. High institutional ownership may indicate positive prospects for the stock, as these investors conduct thorough due diligence before making significant investments. Reviewing institutional ownership in Digital Realty Trust (NYSE: DLR) reveals a lot of activity, both purchasing and selling from institutions indicating each institution's faith or lack of trust in the company.
Each feature plays a vital role in the comprehensive analysis of real estate stocks. Investors should consider combining these factors to develop a well-rounded understanding of a real estate company's potential and risks before making investment decisions.
Pros and Cons of Investing in Real Estate
As with any investment strategy, weigh the pros and cons before investing. While real estate offers numerous opportunities for wealth creation and portfolio diversification, understand this asset class's advantages and potential drawbacks.
Let's examine the pros and cons of investing in real estate to provide investors with a comprehensive overview of the key factors to consider. By gaining insights into the benefits and challenges, you will be better equipped to make informed decisions and navigate the dynamic landscape of real estate investments.
Pros
The benefits can include:
- Potential for appreciation: Real estate has a proven track record of long-term appreciation, allowing investors to benefit from capital gains as property values increase.
- Cash flow and passive income: Rental properties can generate consistent cash flow, providing investors with a steady stream of passive income. Rental income can help offset mortgage payments and expenses while potentially generating a surplus.
- Portfolio diversification: Real estate investments offer diversification benefits by adding an alternative asset class to your portfolio. This diversification can mitigate risks associated with traditional investments, such as stocks and bonds.
- Tangible asset: Unlike stocks or bonds, physical real estate investments provide tangible assets you can see, touch and control. This aspect can offer a sense of security and stability to investors.
- Tax advantages: Real estate investments often come with tax benefits, including deductions for mortgage interest, property taxes, depreciation and expenses. These tax advantages can help reduce your overall tax liability.
Cons
The downsides can include:
- High initial capital requirement: Investing in physical properties typically requires a substantial upfront investment, including down payments, closing costs and ongoing maintenance expenses. It can limit entry for some investors.
- Property management and maintenance: Owning and managing real estate properties can be time-consuming and require active involvement. Dealing with tenants, property maintenance and unexpected repairs can complicate your investment journey.
- Market volatility: Real estate markets can experience fluctuations influenced by various factors such as economic conditions, interest rates and local market dynamics. This volatility can impact property values and rental income.
- Liquidity challenges: Real estate investments are relatively illiquid compared to stocks or bonds. Selling a property may take time and involve transaction costs, limiting your ability to access funds if needed quickly.
- Market knowledge and risk: Successful real estate investing requires a deep understanding of market trends, local regulations and property valuation. Lack of knowledge or miscalculations can lead to financial losses or missed opportunities.
Build Your Empire, Brick by Brick
Real estate investing offers a promising avenue for individuals seeking wealth creation and portfolio diversification. Real estate investments provide unique advantages, including the potential for appreciation, passive income generation, portfolio diversification and tax advantages. The tangible nature of real estate assets adds a sense of security and stability to your investment portfolio.
However, successful real estate investing requires knowledge and understanding. Staying informed about market trends, property valuation and risk assessment is essential. By equipping yourself with this knowledge and seeking the guidance of experienced investors, you can make informed decisions and navigate the dynamic landscape of real estate investments effectively.
Tailoring your investment strategy to your financial goals, risk tolerance, and timeline is crucial. Whether you choose physical properties, real estate stocks, bonds, ETFs or REITs, customizing your portfolio will ensure a well-balanced and diversified approach.
As you embark on your real estate investment journey, remember to continuously educate yourself, adapt to market dynamics and make well-informed decisions. By doing so, you can work toward achieving your financial aspirations through real estate investments with confidence. Embrace the opportunities, leverage your knowledge and make strategic decisions as you embark on this exciting investment path.
FAQs
As you embark on your real estate investment journey, you may have some questions. Let's discuss the most frequently asked questions to provide valuable insights. From getting started as a beginner to investing with limited funds, we have answers to common queries that can help you navigate the world of real estate investing.
How do beginners start real estate investing?
For beginners, starting in real estate investing begins with education and research. Begin by understanding the basics of real estate investing, including different investment options and strategies. Consider networking with experienced investors, attending seminars or workshops and reading reputable books or online resources. Building a solid foundation of knowledge will empower you to make informed decisions and minimize risks as you enter the real estate market.
What is the best real estate to invest in for beginners?
The best real estate investment for beginners depends on various factors such as location, budget and personal preferences. Some common options for beginners include single-family homes, duplexes or small multi-unit properties. These types of properties often provide simplicity in terms of management and financing.
Additionally, exploring real estate investment trusts (REITs) or real estate crowdfunding platforms can be a viable option for beginners to gain exposure to the real estate market with lower capital requirements.
How do you start investing in real estate with as little as $500?
Starting with limited funds may seem challenging, but there are options to invest in real estate with smaller amounts. Real estate crowdfunding platforms allow individuals to pool their resources and collectively invest in real estate projects. Crowdfunding enables you to access a diversified portfolio of properties with relatively low investment amounts.
Exploring real estate investment trusts (REITs), stocks and ETFs can provide an opportunity to invest in real estate with smaller capital. These investment vehicles allow you to buy shares in a professionally managed real estate portfolio.
