What a difference a year makes. In fall 2025, markets expected 2026 to bring rate cuts. The Trump administration’s tariffs had been muted, the job market was shaky, and disinflation was the presumed economic outcome. But much like the calls for a recession in 2023, the real world has a funny way of making prognosticators look foolish. The Federal Reserve raised rates for the first time in three years on Sept. 16, moving the benchmark overnight rate up 25 basis points (bps). The vote was unanimous, and many Fed officials see room for more hikes before year-end.
The immediate market reaction was a sell-off, but the following day stocks surged despite prospects of further hikes in 2026 (and 2027). A new hiking cycle is usually good news for the financial sector, and many investors will screen for banks that benefit most in that environment. However, banks aren’t the only businesses in finance, and many brokers and exchanges stand to reap rewards from rising short-term rates.
Why Brokers and Exchanges Deserve a Look
The rate path flipped on its head in less than 12 months due to persistent energy-driven inflation. Stoked by the war in Iran and subsequent closure of the Strait of Hormuz, WTI crude futures soared from under $60 per barrel in January to over $105 by September. And with no exit ramp in sight, the interest rate path remains murky and influenced by factors far beyond the Fed’s control.
The market typically views rate hikes as foul-tasting medicine; a needed remedy that goes down bitter. Higher rates mean that lenders can charge more for loans, but they also need to fight to keep deposits. Brokers and exchanges often benefit more than banks during rate hike cycles due to three factors:
Net interest income (NII) on cash sweeps and margin loans
Customers holding more cash for higher yields and less speculative trading
Demand for hedging products
Unlike banks, brokers and exchanges have no long-duration loan book and don’t need to worry about deposit beta. Customer cash spreads and margin loans reprice far more quickly in these cycles than typical banking activity, and the three companies listed below each offer a different way to profit in this environment.
Interactive Brokers: The Cleanest Beneficiary of a 25-Basis-Point Hike
Interactive Brokers Group Today
IBKR
Interactive Brokers Group
$90.69 +2.31 (+2.61%) As of 09/18/2026 04:00 PM Eastern
- 52-Week Range
- $58.95
▼
$98.75 - Dividend Yield
- 0.39%
- P/E Ratio
- 36.28
- Price Target
- $98.90
Interactive Brokers Group Inc. NASDAQ: IBKR might be the most immediate beneficiary of a 25 bps hike, but you don’t need to take my word for it.
During the conference call for the company’s fiscal Q2 2026 earnings report on July 21, CFO Paul Brody estimated that a 25 bps hike would add $81 million in annual NII.
In Q2, NII rose 23% to $1.06 billion, so adding $81 million to an annualized NII figure of $4.2 billion means about a 2% lift for every 25 bps. NII also represented more than 56% of total Q2 revenue, so the rate story very much dominates this stock.
Interactive Brokers grew NII through the earlier part of the year thanks to expanding account balances, so this rate hike adds a tailwind to an already growing segment. Margin loan interest grew 39%, and margin loan balances were up 67% year-over-year (YOY) to $108.5 billion.
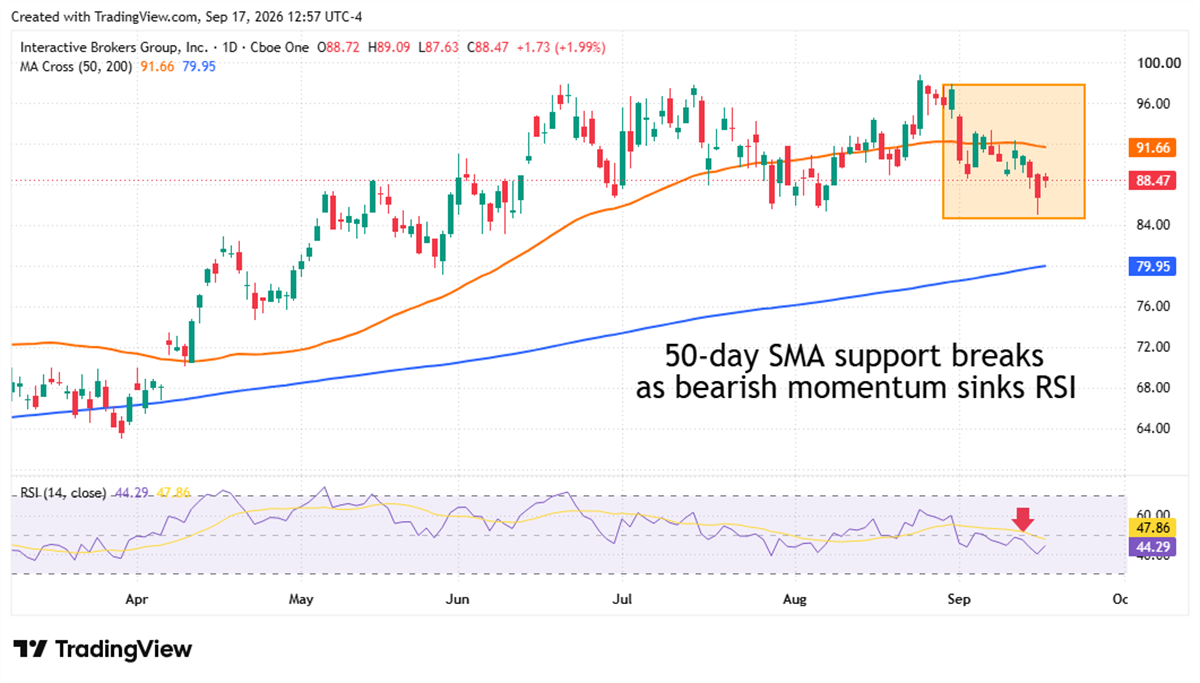
But investors should be cautious; this rate hike was widely priced in, and IBKR shares likely need another catalyst to resume their rally. Support at the 50-day moving average has broken ahead of the fiscal Q3 2026 report on Oct. 20, and the Relative Strength Index (RSI) has dipped into bearish territory.
Robinhood: Interest Exposure at Odds With Growth Appetite
Robinhood Markets Today
HOOD
Robinhood Markets
$119.82 +10.01 (+9.12%) As of 09/18/2026 04:00 PM Eastern
- 52-Week Range
- $63.51
▼
$153.86 - P/E Ratio
- 52.78
- Price Target
- $130.88
The story within Robinhood Markets Inc. NASDAQ: HOOD is a little muddier.
On one hand, Robinhood earns payment for order flow, so the company earns more profit when trading volumes are high, especially on speculative assets like options or cryptocurrencies.
On the other hand, net interest revenue (NIR) grew 9% YOY in fiscal Q2 2026, and the margin book more than doubled to a record $21.6 billion.
The growth vs. interest conflict is at the heart of the Robinhood thesis; if speculative risk appetite slows, the loss of trading revenue could more than offset the gains in interest revenue.
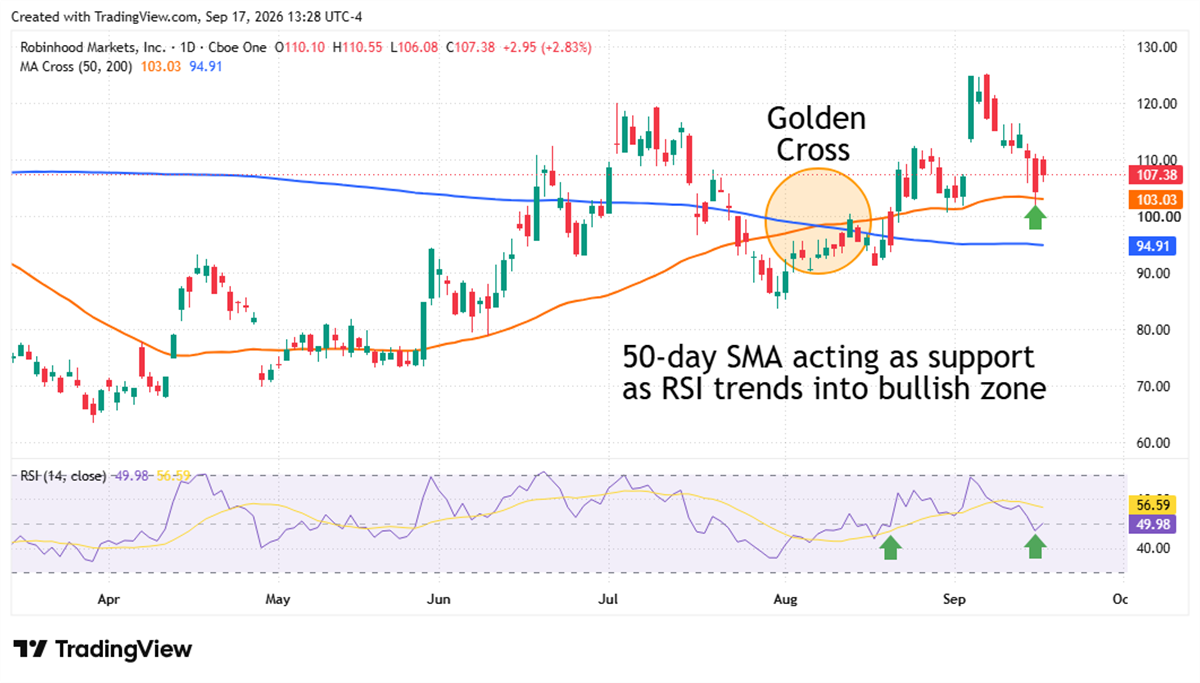
Traders bid up HOOD shares more than 12% in the month ahead of the expected rate hike, and now some technical signals have reset to the upside. The RSI is once again trending above the bullish threshold of 50, and a Golden Cross in August affirmed support at the 50-day moving average.
CME Group: The Best Bet on an Uncertain Rate Path
CME Group Today
$276.09 +4.94 (+1.82%) As of 09/18/2026 03:59 PM Eastern
This is a fair market value price provided by Massive. Learn more. - 52-Week Range
- $218.31
▼
$329.16 - Dividend Yield
- 1.88%
- P/E Ratio
- 23.42
- Price Target
- $289.75
Fed officials have made it clear the rate path is littered with potential obstacles, and an uncertain future might be the best one for CME Group Inc. NASDAQ: CME.
CME operates global derivatives marketplaces where investors can bet on SOFR, Fed funds, and Treasury futures, and the more uncertainty reigns, the more demand for these hedging products will increase.
Average daily volume (ADV) was up 8% YOY in fiscal Q2 2026, and August numbers showed that nearly 30 million contracts were traded ahead of the Fed decision.
The September hike was widely telegraphed, and trading volumes still grew strongly. An uncertain path in 2027 could unlock even more value in CME shares.
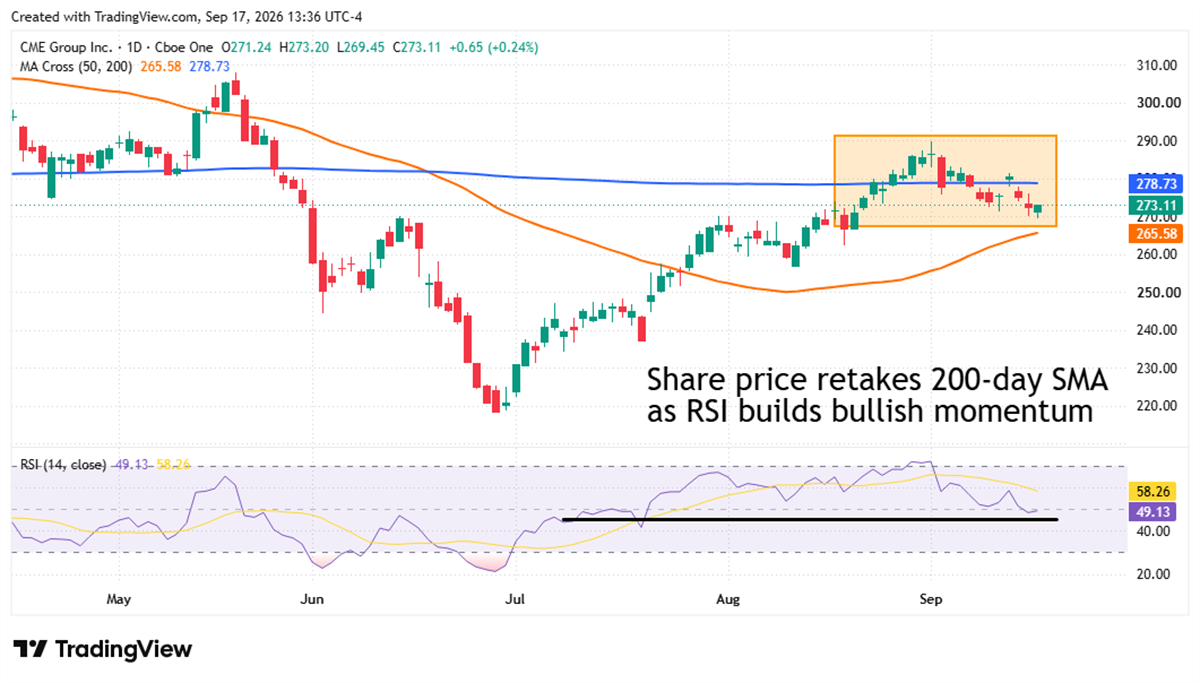
CME shares regained the 200-day moving average in the weeks leading up to the Fed meeting, and this level will need to hold as support for more short-term gains. The RSI has reset from its Overbought reading but still maintains bullish momentum, so investors will need to monitor these technical trends ahead of the fiscal Q3 2026 earnings catalyst on Oct. 21.
Before you consider Interactive Brokers Group, you'll want to hear this.
MarketBeat keeps track of Wall Street's top-rated and best performing research analysts and the stocks they recommend to their clients on a daily basis. MarketBeat has identified the five stocks that top analysts are quietly whispering to their clients to buy now before the broader market catches on... and Interactive Brokers Group wasn't on the list.
While Interactive Brokers Group currently has a Moderate Buy rating among analysts, top-rated analysts believe these five stocks are better buys.
View The Five Stocks Here
A strong long-term portfolio starts with companies that can survive recessions, inflation, changing consumer habits, and shifting market leadership.
This report names seven blue-chip stocks across technology, retail, consumer staples, healthcare, networking, sporting goods, and utilities that offer investors a mix of stability, income, growth, and staying power.
Get This Free Report
Continue following MarketBeat
Add MarketBeat as your preferred source on Google to see our latest stories in your feed.
