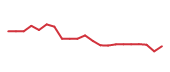
NTAP NetApp | $177.49
-2.1% | Purchase
$15,001 - $50,000 | 6/10/2026 | 5/29/2026 | +1.8%
 |
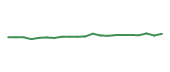
MWA Mueller Water Products | $24.05
-0.6% | Purchase
$15,001 - $50,000 | 6/10/2026 | 5/29/2026 | -4.6%
 |
| DELL TECHNOLOGIES INC CL C | N/A | Purchase
$15,001 - $50,000 | 6/10/2026 | 5/29/2026 | |
V Visa | $426.58
+0.2% | Sale
$50,001 - $100,000 | 6/10/2026 | 5/29/2026 | +30.2%
 |
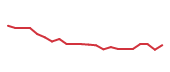
AMZN Amazon.com | $257.45
-3.5% | Sale
$15,001 - $50,000 | 6/10/2026 | 5/28/2026 | -6.0%
 |
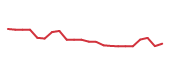
META Meta Platforms | $625.88
-2.5% | Purchase
$15,001 - $50,000 | 6/10/2026 | 5/28/2026 | -1.5%
 |
HAYW Hayward | $16.17
-1.7% | Purchase
$15,001 - $50,000 | 6/10/2026 | 5/28/2026 | +14.7%
 |
| ONEMAIN HLDGS INC COM | N/A | Purchase
$15,001 - $50,000 | 6/10/2026 | 5/28/2026 | |
| VIRGINIA ST PUB BLDG AUTH PUB FACS REV | N/A | Purchase
$100,001 - $250,000 | 6/10/2026 | 5/28/2026 | |
BNRE Brookfield Reinsurance | $40.91
-0.7% | Purchase
$100,001 - $250,000 | 6/10/2026 | 5/28/2026 | -11.0%
 |
FICO Fair Isaac | $719.06
-0.2% | Purchase
$15,001 - $50,000 | 6/10/2026 | 5/28/2026 | -44.6%
 |
FCN FTI Consulting | $206.58
+1.9% | Purchase
$15,001 - $50,000 | 6/10/2026 | 5/28/2026 | +33.3%
 |
HURN Huron Consulting Group | $172.52
+1.7% | Purchase
$15,001 - $50,000 | 6/10/2026 | 5/28/2026 | +61.3%
 |
| METROPOLITAN WASH D CARPTS | N/A | Purchase
$100,001 - $250,000 | 6/10/2026 | 5/28/2026 | |
ARW Arrow Electronics | $186.41
-3.4% | Sale
$100,001 - $250,000 | 6/10/2026 | 5/27/2026 | -14.2%
 |
FCFS FirstCash | $180.21
-2.4% | Sale
$15,001 - $50,000 | 6/10/2026 | 5/27/2026 | -22.1%
 |
EQT EQT | $51.14
-3.2% | Purchase
$1,001 - $15,000 | 6/10/2026 | 5/27/2026 | -7.3%
 |
| NEW CANAAN CONN GO | N/A | Purchase
$50,001 - $100,000 | 6/10/2026 | 5/26/2026 | |
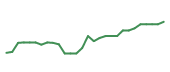
APH Amphenol | $75.35
-3.7% | Purchase
$15,001 - $50,000 | 6/10/2026 | 5/26/2026 | +8.1%
 |
| NORTHERN INTERMED TAX EXEMPT FUND | N/A | Purchase
$50,001 - $100,000 | 6/10/2026 | 5/26/2026 | |
| ATI INC | N/A | Purchase
$15,001 - $50,000 | 6/10/2026 | 5/26/2026 | |
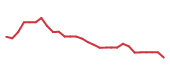
MSFT Microsoft | $517.57
-1.2% | Sale
$15,001 - $50,000 | 6/10/2026 | 5/26/2026 | +24.4%
 |
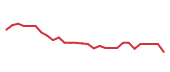
AMZN Amazon.com | $257.45
-3.5% | Sale
$15,001 - $50,000 | 6/10/2026 | 5/26/2026 | -3.0%
 |
| NORTHERN INTERMED TAX EXEMPT FUND | N/A | Purchase
$1,001 - $15,000 | 6/10/2026 | 5/26/2026 | |
| NORTHERN TAX-ADVGT ULTRA-SHRT FIXED INC | N/A | Purchase
$1,001 - $15,000 | 6/10/2026 | 5/26/2026 | |
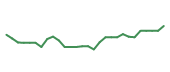
KEYS Keysight Technologies | $285.19
-4.2% | Purchase
$1,001 - $15,000 | 6/10/2026 | 5/26/2026 | -19.7%
 |
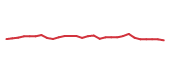
SPGI S&P Global | $471.29
-0.5% | Purchase
$1,001 - $15,000 | 6/10/2026 | 5/26/2026 | +14.3%
 |
ENTG Entegris | $140.17
-4.9% | Purchase
$1,001 - $15,000 | 6/10/2026 | 5/26/2026 | -1.4%
 |
APH Amphenol | $75.35
-3.7% | Purchase
$15,001 - $50,000 | 6/10/2026 | 5/22/2026 | +13.9%
 |
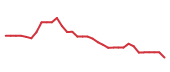
MSFT Microsoft | $517.57
-1.2% | Sale
$50,001 - $100,000 | 6/10/2026 | 5/22/2026 | +23.7%
 |
| NORTHERN INTERMED TAX EXEMPT FUND | N/A | Sale
$50,001 - $100,000 | 6/10/2026 | 5/22/2026 | |
| ATI INC | N/A | Purchase
$15,001 - $50,000 | 6/10/2026 | 5/22/2026 | |
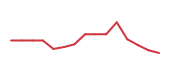
INTU Intuit | $345.41
+1.1% | Sale
$15,001 - $50,000 | 6/10/2026 | 5/22/2026 | +8.0%
 |
ENTG Entegris | $140.17
-4.9% | Purchase
$1,001 - $15,000 | 6/10/2026 | 5/22/2026 | +3.6%
 |
DHR Danaher | $230.00
-1.3% | Purchase
$1,001 - $15,000 | 6/10/2026 | 5/22/2026 | +33.6%
 |
NOW ServiceNow | $99.32
-2.9% | Purchase
$1,001 - $15,000 | 6/10/2026 | 5/22/2026 | -2.8%
 |
KEYS Keysight Technologies | $285.19
-4.2% | Purchase
$1,001 - $15,000 | 6/10/2026 | 5/22/2026 | -17.7%
 |
SIE Sienna Resources | C$0.02
| Purchase
$1,001 - $15,000 | 6/10/2026 | 5/22/2026 | |
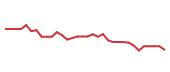
SPOT Spotify Technology | $611.35
-0.2% | Purchase
$1,001 - $15,000 | 6/10/2026 | 5/22/2026 | +17.8%
 |
WWD Woodward | $310.03
-6.0% | Sale
$1,001 - $15,000 | 6/10/2026 | 5/21/2026 | -12.9%
 |
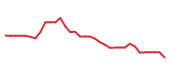
MSFT Microsoft | $517.57
-1.2% | Sale
$1,001 - $15,000 | 6/10/2026 | 5/21/2026 | +23.5%
 |
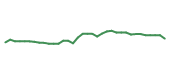
AJG Arthur J. Gallagher & Co. | $287.13
+1.5% | Purchase
$15,001 - $50,000 | 6/10/2026 | 5/20/2026 | +41.2%
 |
VSH Vishay Intertechnology | $25.34
-4.8% | Sale
$50,001 - $100,000 | 6/10/2026 | 5/20/2026 | -36.8%
 |
AER AerCap | $172.99
-1.5% | Sale
$15,001 - $50,000 | 6/10/2026 | 5/20/2026 | +24.0%
 |
ST Sensata Technologies | $37.21
-3.5% | Sale
$50,001 - $100,000 | 6/10/2026 | 5/20/2026 | -22.0%
 |
| NORTHERN TAX-ADVGT ULTRA-SHRT FIXED INC | N/A | Sale
$15,001 - $50,000 | 6/10/2026 | 5/20/2026 | |
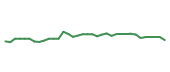
PAYX Paychex | $117.74
+1.8% | Purchase
$15,001 - $50,000 | 6/10/2026 | 5/20/2026 | +24.0%
 |
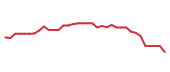
CACI CACI International | $637.06
-0.8% | Purchase
$50,001 - $100,000 | 6/10/2026 | 5/20/2026 | +29.4%
 |
| NORTHERN TAX-ADVGT ULTRA-SHRT FIXED INC | N/A | Sale
$1,001 - $15,000 | 6/10/2026 | 5/20/2026 | |
