What is the ex-dividend date, and why is it important? The ex-dividend date is when you must own a share of stock to qualify for a dividend payment. While this basic ex-dividend date meaning is important, it only tells some of the story you should know as an investor. Learn more about ex-dividend date stocks and the multiple dates dividend investors should know.
What is an Ex-Dividend Date?
Before discussing the ex-dividend date and why it's important, defining a dividend is crucial. Dividend payments are shares of a company's profit that the company elects to pay out to investors who hold the stock. Dividends typically pay out quarterly, but some companies offer annual or monthly dividend payments.
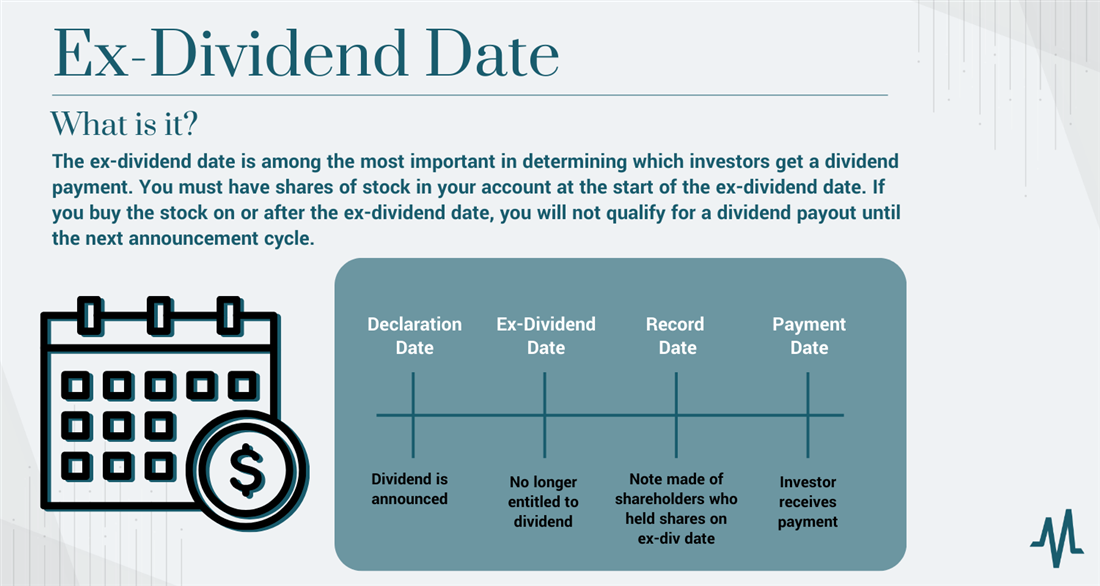
A company that issues dividends stocks must maintain a dividend payment date calendar to keep track of which investors qualify for dividend payments. The ex-dividend date is among the most important in determining which investors get a dividend payment. You must have shares of stock in your account at the start of the ex-dividend date. If you buy the stock on or after the ex-dividend date, you will not qualify for a dividend payout until the next announcement cycle.
Overview of the Ex-Dividend Date
What is the ex-dividend date in the context of other important in the payment process? The ex-dividend date and the date of record are the two most important dates in determining which investors qualify for a dividend distribution.
While the ex-dividend date is when you must be an investor in a stock to qualify for a dividend payment, companies only take an official record of these investors on the date of record. Investors who own shares on the record date will receive the declared dividend, regardless of whether they sell the shares afterward. The date of record is usually scheduled to be the business day after the ex-dividend date.
Why aren't the ex-dividend date and the record date on the same calendar day? While it often seems like retail brokerage transactions occur instantly, this is not often true. When shares are bought or sold in the stock market, there may be a settlement period during which the transaction is processed and finalized. This settlement period typically takes a few business days after the trade date.
Having an ex-dividend date that precedes the record date allows for the settlement of stock transactions that occurred before the record date, ensuring fair and efficient dividend records and payments. Some short-term investment strategies rely on strategically investing in well-known companies that pay dividends before ex-dividend dates, "capturing" the dividend and then selling the stock or dividend-producing ETF shortly after.
Key Terms for Dividend Investors
The ex-dividend date and the date of record aren't the only important dates you should know as a dividend investor. The following are some additional important dates that all dividend investors should know.
Declaration Date
The dividend declaration date is when a company's board of directors announces its intention to pay a dividend. The declaration date announcement usually includes the dividend amount, the payment date and the ex-dividend date. Note that the declaration is not a legal obligation to pay a dividend and is simply a notice given to investors. While uncommon, a dividend payment can change or be canceled after the declaration.
Record Date
The date of record (or "record date") is the cutoff date set by the company to determine which shareholders are eligible to receive the dividend. Investors who own shares on this date will receive the declared dividend even if they sell their shares in between the record date and the payment date. Unlike the record date and the ex-dividend date, which are usually consecutive, the record date may precede the actual payment date by a week or more.
Payment Date
As the name suggests, the payment date is when the dividend is paid to shareholders. Log into your brokerage account to see your dividend distribution in your account by the close of the payment date. If you have a DRIP enabled, reinvestment will usually be executed at the market open the next business day.
Example of Ex-Dividend Date
Let's look at an example of a stock that issues dividends and how these dates play into payments. MPLX LP (NYSE: MPLX), a crude oil pipeline company, pays out an impressive dividend yield of 9.05%. In May 2023, MPLX pays out a quarterly dividend of about 78 cents for each investor's share.
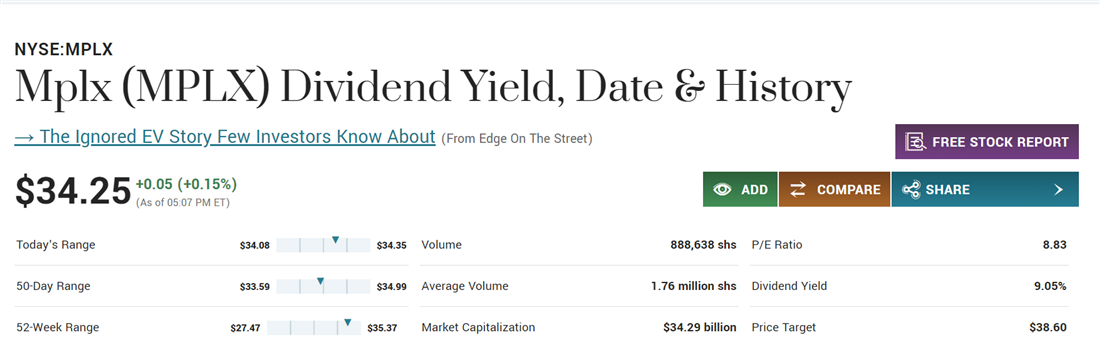
Image: With a dividend yield of 9.05%, MPLX LP is a major dividend stock in 2023.
MPLX LP announced its dividend to the public on April 25, 2023. Company management announced that its quarterly earnings and revenue allowed it to pay out a dividend of about 78 cents per share. They also announced that the ex-dividend date would be May 4, meaning that investors would have the opportunity to earn a dividend if they purchased the stock between April 25 and May 3.
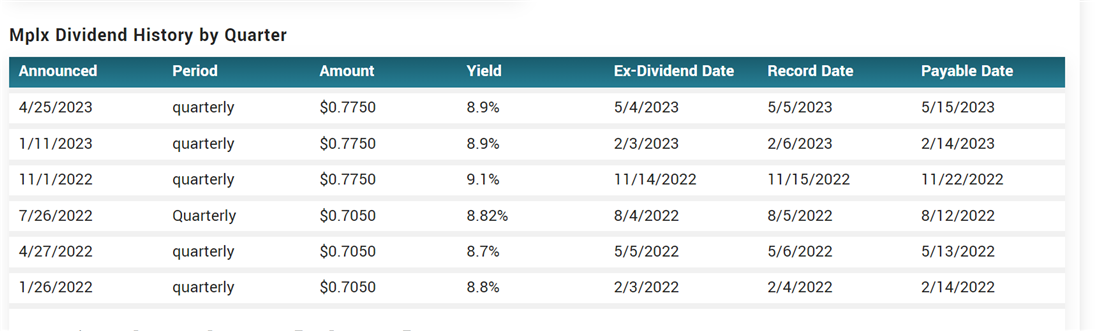
Image: MPLX’s dividend calendar provides a perfect example of a regular quarterly dividend schedule.
The company recorded share information on investors who owned MPLX on May 5. Investors received their dividends credited to their brokerages by the end of the May 15 trading day.
How Do Traders Execute a Dividend Capture Strategy?
The dividend capture strategy is an investment technique in which an investor aims to capture a dividend payment by buying a share of stock just before the ex-dividend date and selling shortly after that. The goal is to sell the stock at or above the price they purchased it at, taking the dividend as profit.
In this strategy, you identify a stock scheduled to pay a dividend. Depending on your investment strategy, you might look for stocks trending in the media or are more likely to be undervalued. The investor then purchases the stock before the ex-dividend date. You can receive the upcoming dividend payment by owning the stock on or before the ex-dividend date.
On the ex-dividend date, the stock begins trading without the dividend. The stock price usually adjusts downward on the ex-dividend date to account for the dividend value that will be paid out. This means that the stock price may drop by approximately the dividend amount. However, this price adjustment is only sometimes exact and can be influenced by other market factors, which investors may be able to take advantage of to increase their trade profit.
From the opening bell on the ex-dividend date, the investor looks to identify an opportunity to sell the stock at or above the price they paid. They may continue to look for other stocks that anticipated to pay out a dividend soon and repeat this strategy multiple times.
Investing for Dividends
Consistent dividend payments attract income-seeking investors, who may prioritize regular income streams over the potential for future growth and share price capital appreciation. This increased demand for dividend-paying stocks can drive up their prices, pushing the valuation of these stocks to higher levels. Stocks with a consistent history of paying out dividends may be overvalued by the market, making it important for investors to look at revenue and earnings before investing.
Investors looking for dividend income streams should also be wary of dividend traps. A dividend trap refers to a situation where investors are lured into investing in a stock solely based on its high dividend yield without considering the underlying financial health and sustainability of the dividend. Be wary of stocks with exceptionally high dividend yields above 10%, which may be less sustainable and be more prone to cuts.
FAQs
Ready to start considering dividend stocks for your investment portfolio? The following are answers to some last-minute questions you might have about dividend stocks and payment dates.
Will I get a dividend if I buy on the ex-date?
No, you will not receive the upcoming dividend payment if you buy a stock on the ex-dividend date or after. The ex-dividend date is the first day the stock trades without dividends. To be eligible to receive the dividend, you must purchase the stock before the ex-dividend date and hold it through the record date.
Is it better to buy before or after the ex-dividend date?
Whether it is better to buy a stock before or after the ex-dividend date depends on your investment goals and strategy. You should buy the stock before the ex-dividend date to receive the upcoming dividend payment. If you're looking for a more affordable share price, buying on or shortly after the ex-dividend date could be a more financially advantageous move.
What is the difference between the ex-dividend date and pay date?
The ex-dividend date and the payment date are two distinct dates in the dividend distribution calendar. The ex-dividend date is when a stock begins trading without the right to receive the upcoming dividend. The payment date is when investors receive credit for the dividends they're entitled to in their accounts.