What is the S&P 500 index? This article will demystify the S&P 500 and explore how it influences investment strategies. You will learn about its constituent companies, which form the backbone of the index.
Plus, we will show you the powerful concept of S&P 500 index funds, which allow you to invest in the collective success of these giants. If you are seeking stability, growth, or a combination of both in your investment portfolio, understanding the S&P 500 definition is a crucial step in your financial journey.
What is the S&P 500 Index?
The S&P 500 definition, Standard & Poor's 500 Index, is not just a mundane list of companies but a meticulously curated collection of 500 of the most influential publicly traded companies in the United States. It's like a financial gallery showcasing the brightest stars across various industries and sectors. What exactly is the S&P 500? It reflects the American economic landscape, a snapshot of the nation's corporate giants. These 500 companies undergo rigorous selection based on market capitalization, liquidity and prominence. It's a testament to the economic prowess of the United States, focusing exclusively on companies based within its borders.
Beyond being a mere list, the S&P 500 is a benchmark against which investment portfolios and mutual funds measure performance. Outperforming the S&P 500 is a notable achievement for investors and investment funds. While you can not directly invest in the S&P 500, it opens the door to a world of investment opportunities and options. The S&P 500 isn't just a number; it's a dynamic reflection of the U.S. economy. It offers insights, shapes investment strategies and profoundly impacts the financial landscape. As we journey through this guide, you'll discover how the S&P 500 can be your guiding star in the intricate world of investments.
When was the S&P 500 Index Created?
The Standard and Poor 500 index was created in 1957 as the renowned credit rating agency Standard & Poor's brainchild. Its primary objective was to provide a comprehensive measure of the U.S. stock market's performance, focusing on the large-cap sector. The timing was strategic, as post-World War II America was experiencing an economic boom, and investors needed a tool to gauge the growing equity market's health and vitality.
You might wonder why it's called the S&P "500." The choice of 500 companies was deliberate. It was deemed sufficient to represent a broad cross-section of industries and sectors while ensuring the index remained manageable and reflected larger market trends. The selected companies were not arbitrary; they underwent a rigorous selection process to ensure their prominence and liquidity.
The process of creating the S&P 500 involved meticulous research and data analysis. Standard & Poor's carefully examined thousands of publicly traded companies, evaluating their market capitalization, liquidity and overall prominence.
The S&P 500 was not just another financial index but a game-changer. It provided investors with a yardstick against which they could measure the performance of their portfolios. Over time, it became a symbol of American economic prowess and stability, serving as a beacon for domestic and international investors.
The S&P 500's creation marked a significant moment in financial history. It ushered in an era of benchmarking and index investing, fundamentally altering how investors approached the stock market. Today, it's not just a measure of performance; it's a barometer for the overall health of the U.S. economy.
What Companies Comprise the S&P 500 Index?
What companies are in the S&P 500? At its core, the Standard and Poor 500 is a collection of 500 leading publicly traded companies in the United States. These companies comprehensively represent the U.S. stock market, making the index a reliable investor benchmark. A company must be publicly traded on a U.S. stock exchange and based in the United States to be eligible for inclusion in the S&P 500. Private companies or those not listed on a U.S. exchange do not qualify for the index.
While these are the fundamental requirements, companies must meet more specific criteria to become part of this exclusive club. One crucial factor is market capitalization, often referred to as market cap. Market cap is calculated by multiplying a company's stock price by the total number of outstanding shares. Simply put, it's the total value of all a company's outstanding stock.
The S&P 500 includes companies with various market capitalizations, from the largest corporations to mid-sized companies. This diversity allows the index to represent different segments of the U.S. economy. Understanding who these companies are is crucial in comprehending the S&P 500's impact on investing.
How Are Companies in the S&P 500 Index Selected?
Understanding how companies are chosen for inclusion in the S&P 500 is important for investors looking to grasp the inner workings of this influential index. While we've previously touched on the basic criteria, let's dig deeper into the selection process.
The committee responsible for maintaining the S&P 500 is known as the Index Committee. These experts follow guidelines and methodologies to decide which companies should be part of the index. While the specifics are not fully disclosed to the public, some key factors influence their decisions.
- U.S. incorporation: As mentioned earlier, to be eligible for the S&P 500, a company must be based in the United States. This means the company must be legally incorporated and headquartered within the U.S. borders.
- Market capitalization: Market capitalization remains a central criterion. The committee considers companies with a market capitalization that places them among the top 500 in the U.S. stock market. This ensures that the S&P 500 represents a significant portion of the overall market.
- Liquidity: Liquidity is another vital factor. The stocks of S&P 500 companies must have adequate liquidity, meaning there should be a reasonable amount of trading activity in these stocks. High liquidity ensures that investors can easily buy and sell shares without significantly impacting the stock's price.
- Sector representation: The Index Committee aims for diversity by ensuring that various sectors of the economy are represented in the S&P 500. This prevents the index from being too heavily weighted in a single industry and provides a more comprehensive view of the U.S. economy.
- Financial viability: Companies in the S&P 500 are expected to demonstrate financial stability. This typically includes having positive earnings over a specific period.
It's important to note that the committee reviews the S&P 500 regularly and adjusts as needed. If a company no longer meets the criteria or has significant changes in the market landscape, the committee may replace or add companies to maintain the index's accuracy.
While the specific details of the selection process are not disclosed, the overall goal is to ensure that the S&P 500 remains a reliable barometer of the U.S. stock market. This involves a careful and thoughtful selection of companies that collectively represent the diverse and dynamic nature of the American economy.
Weighting refers to the method used to determine the significance or importance of each company within the index. Not all companies in the index have the same impact on its value; some have a more substantial influence than others. This is where the weighting formula comes into play.
The S&P 500 uses a market-cap weighting method. Market capitalization, often called market cap, measures a company's size in the stock market. It is calculated by multiplying the current stock price of a company by the total number of outstanding shares. The formula for determining a company's weighting in the S&P 500 is as follows:
Weight in S&P 500 = (Company market cap) / (Total of all market caps)
Calculating the Weighting
First, determine the index's total market capitalization to calculate the weighting of each S&P 500 component. This involves adding together the market capitalization of every company included in the index. Fortunately, this information is readily available on financial websites like MarketBeat, so you don't need to perform these calculations manually.
Next, you can compute the weighting of each company in the index by dividing the company's market capitalization by dividing it by the total market capitalization of the entire S&P 500 index.
Why is Weighting Important?
Weighting is a crucial aspect of the S&P 500 because it directly influences its performance. Companies with larger market capitalizations have a more significant impact on the index's value. Here's why weighting matters:
- Reflects market capitalization: Weighting by market cap ensures that the S&P 500 accurately represents the relative size of companies in the U.S. stock market. Larger companies have more influence because they account for a more substantial portion of the total market cap.
- Tracks market trends: When market conditions change, and the stock prices of larger companies fluctuate, it can significantly impact the S&P 500. Investors often monitor these changes closely to gauge the overall health of the stock market.
- Performance benchmark: For investors, the S&P 500 serves as a benchmark for comparing the performance of their investments. Knowing how companies are weighted in the index helps them understand which companies have a more substantial impact on their portfolios.
Weighting is a fundamental aspect of the S&P 500's construction, as it ensures that the index accurately reflects the market's composition and provides valuable insights into the performance of the largest publicly traded companies in the U.S. Understanding how weighting works is essential for investors looking to make informed decisions based on this iconic index.
What is the Average Return, and What Does it Measure?
The average return, often referred to simply as the "average," is a fundamental metric used in finance to evaluate the historical performance of an investment, such as the S&P 500. It gives you insights into how an investment has performed over a specific period, typically measured in years. The average return quantifies the average annual change in the index's value, including price changes and dividends, over a specific time frame. This metric is expressed as a percentage.
The average return of the S&P 500 measures several vital aspects of the index's performance and serves as a valuable tool for investors:
- Historical performance: The average return reflects how the S&P 500 has historically performed over a given period. Investors can use this data to assess the index's track record.
- Risk and volatility: It provides insights into the level of risk associated with investing in the S&P 500. A higher average return may suggest higher volatility and potentially greater investment risk.
- Inflation and purchasing power: Investors use the average return to assess whether their investments have outpaced inflation. If an investment's average return exceeds the inflation rate, it helps preserve and potentially increase the purchasing power of the invested capital.
- Long-term growth potential: For long-term investors, the average return offers a glimpse into the S&P 500's potential for wealth accumulation over extended periods. It helps investors understand what returns they might expect from their investments in the future.
How is the average return calculated? Calculating the average return of the S&P 500 involves collecting historical data on the index's values, typically on a monthly, quarterly or annual basis, depending on the desired measurement period.
Here's a simplified formula for calculating the average return:
Average Return = (Ending Value - Beginning Value + Dividends) / Beginning Value × 100
In this formula:
- "Ending value" represents the final value of the S&P 500 at the end of the chosen period.
- "Beginning value" is the index's initial value at the beginning of the same time period.
- "Dividends" include any dividends paid out by the companies within the index during the period.
Investors and financial analysts typically use specialized software or financial platforms to perform these calculations.
Why Does the Average Return Matter?
The average return of the S&P 500 matters because it helps investors assess the index's historical performance and make informed decisions about their investments. Here's why it's crucial:
- Performance benchmark: The S&P 500's average return serves as a benchmark for evaluating the performance of individual investments or portfolios. It provides a reference point for comparing how well your investments have done relative to the broader market.
- Long-term planning: Investors, especially those with long-term financial goals like retirement planning, rely on the average return to estimate future portfolio growth. It aids in setting realistic expectations and making necessary adjustments to achieve financial objectives.
- Risk assessment: By examining historical average returns alongside other metrics, investors can gauge the level of risk associated with investing in the S&P 500. This information helps in constructing a diversified and balanced investment strategy.
Understanding the average return of the S&P 500 is pivotal for investors seeking to make informed decisions and assess the historical performance of this influential stock market index. Whether you aim to build wealth over time or simply track your investments, the average return provides valuable insights into the past and future of your financial journey.
Example of an S&P 500 Company
Within the vast landscape of the S&P 500, certain companies stand out for their significant market capitalization, innovative prowess and the impact they wield on the global economy.
Let’s dig into three primary S&P 500 components: Apple Inc., Microsoft Corporation and Amazon.com Inc. These companies play a pivotal role within the index and serve as barometers of their respective industries.
Apple Inc. (NASDAQ: AAPL)
Apple Inc. NASDAQ: AAPL is undoubtedly one of the giants within the S&P 500. Renowned for its culture of innovation, Apple has left an indelible mark on the technology landscape. Apple has captured consumers' imaginations worldwide with a diverse product line, including the iconic iPhone, iPad and Mac computers. Apple holds a significant weight of over 7% in the S&P 500, a testament to its prominence. Its presence within the index underscores the importance of stability and innovation within the technology sector. Investors often turn to Apple as a reliable industry performance benchmark.
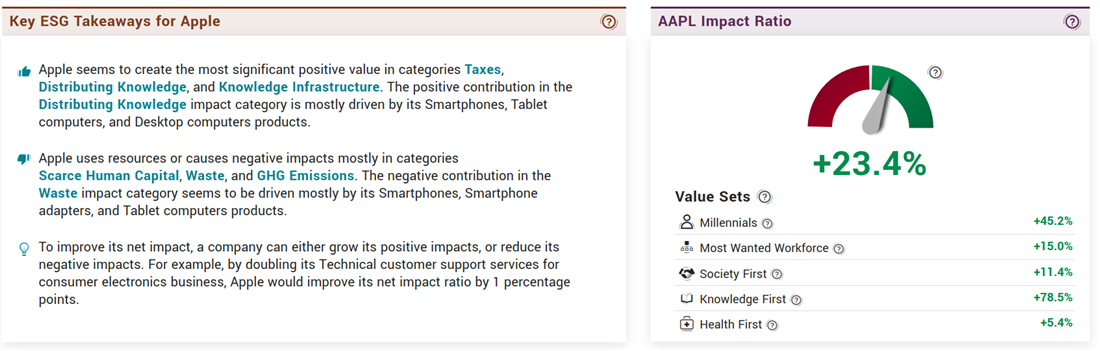
One of the things that makes Apple a vital inclusion in the S&P 500 is its sustainability efforts. In reviewing Apple’s sustainability efforts, you will see that they have set a goal to become carbon neutral across its entire business, manufacturing supply chain and product life cycle by 2030.
This means that by 2030, every Apple device sold will have net zero climate impact. The company is also actively working with suppliers to reduce their environmental impact, employing more sustainable product materials and significantly expanding recycling programs. Apple's commitment to environmental sustainability and its ambitious goals set it apart as a responsible and forward-thinking member of the S&P 500, setting a strong example for others to follow.
Microsoft Corporation (NASDAQ: MSFT)
Microsoft Corporation NASDAQ: MSFT is another stalwart within the S&P 500. This multinational technology conglomerate is a powerhouse in both software and hardware markets. You can feel Microsoft's influence across the tech landscape, as it's known for developing, manufacturing, licensing and supporting a wide array of products and services. Microsoft's inclusion highlights the significance of technology companies in propelling the broader market forward.
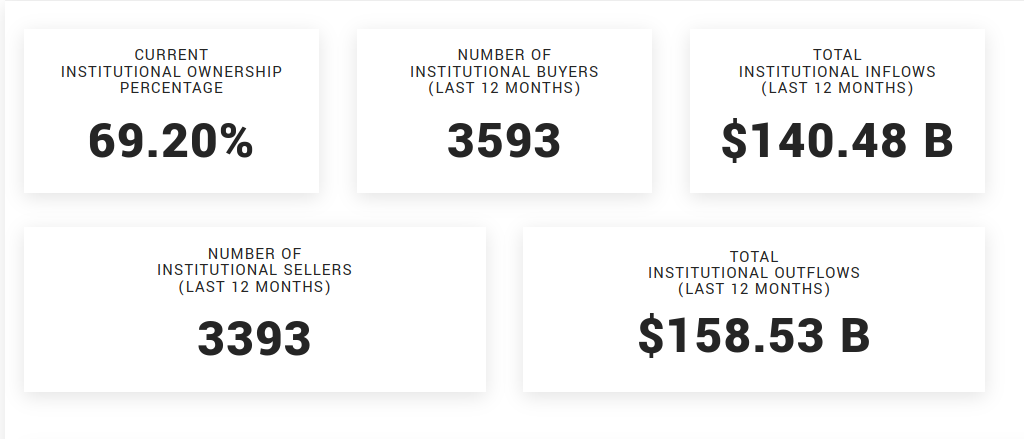
Microsoft Corporation’s institution ownership is one of the reasons it holds a notable position in the S&P 500. Major financial entities like Vanguard Group Inc., Blackrock Inc. and State Street Corporation primarily own Microsoft. Institution owners hold around 70% of shares. This institutional presence underscores Microsoft's significance within the index.
Amazon.com Inc. NASDAQ: AMZN is a heavyweight in the S&P 500, operating at the intersection of e-commerce, cloud computing, digital streaming and artificial intelligence. Based in Seattle, Washington, Amazon's diversification across multiple sectors makes it a unique entity within the index. With a weight of around 3% in the S&P 500, Amazon signifies the transformative power of e-commerce and digital services on the broader market. Its inclusion reflects the growing importance of online retail and cloud computing in shaping the investment landscape.
How to Invest in the S&P 500
If you're interested in investing in the S&P 500, several avenues are available, each with advantages and considerations. Let’s explore how you can invest in the S&P 500 and how each investment platform caters to various preferences and risk profiles.
S&P 500 Index Funds
One of the most straightforward and popular ways to invest in the S&P 500 is through S&P 500 index funds. What is the S&P 500 index fund? These funds are designed to replicate the performance of the S&P 500 index itself. When you invest in an S&P 500 index fund, you buy a piece of all the companies in the index. This diversifies 500 of the largest publicly traded U.S. companies in various sectors.
S&P 500 index funds are known for their low expense ratios and are considered a cost-effective way to gain exposure to the broad U.S. stock market. They are typically managed passively, aiming to mimic the index's performance rather than actively selecting individual stocks.
Exchange-Traded Funds (ETFs)
Exchange-traded funds (ETFs) offer another investment route in the S&P 500. ETFs are similar to index funds but are traded on stock exchanges, allowing investors to buy and sell them throughout the trading day at market prices.
ETFs provide flexibility and liquidity, making them suitable for active traders and long-term investors. They are also known for their tax efficiency, as the creation and redemption process helps minimize capital gains distributions. What are S&P 500 ETFs? Examples of S&P 500 ETFs include the Vanguard 500 Index Fund NYSEARCA: VOO and the SPDR S&P 500 ETF Trust NYSERCA: SPY.
Individual Stocks
For those who prefer a hands-on approach, you can invest in individual stocks of companies within the S&P 500. This approach gives you more control over your investments and potentially choose specific companies you believe in. However, it's important to note that investing in individual stocks requires research, due diligence and monitoring of each company's performance.
Mutual Funds
Mutual funds provide another avenue for investing in the S&P 500. Some actively managed mutual funds focus on selecting S&P 500 stocks to outperform the index. Due to the active management involved, these funds may have higher expense ratios than index funds and ETFs.
Additionally, some mutual funds are structured as target-date or retirement funds, automatically adjusting their asset allocation over time. These can be suitable for investors with long-term goals like retirement planning.
Options and Futures
For experienced investors, options and futures contracts on the S&P 500 can provide opportunities for trading and hedging strategies. These derivative products are leveraged and can be complex, so they are generally not recommended for beginners.
Retirement Accounts
Consider utilizing tax-advantaged retirement accounts like 401(k)s or Individual Retirement Accounts (IRAs) to invest in the S&P 500. Many employer-sponsored retirement plans offer S&P 500 index funds or similar options as part of their investment lineup.
It's essential to align your investment strategy with your financial goals, risk tolerance and time horizon. Diversifying your portfolio across various asset classes, including U.S. stocks from the S&P 500, can help you manage risk while seeking potential returns.
How Often Do the Companies in the S&P 500 Change?
You may wonder how often the companies in the S&P 500 change, as this is a crucial aspect of understanding the dynamics of this prominent stock market index. The constituents of the S&P 500 are subject to periodic adjustments to ensure that the index accurately reflects the ever-evolving landscape of the U.S. stock market.
These changes are carried out regularly, specifically on the third Friday of March, June, September and December. This quarterly rebalancing is a well-established practice to maintain the index's accuracy and relevance. It considers several factors, including the relative market capitalization and overall financial health of the companies in the index.
In addition to these scheduled quarterly adjustments, changes can occur within a quarter, referred to as intra-quarter changes. These changes typically arise from specific events that affect a company's eligibility to remain in the S&P 500. Some common reasons for such changes include corporate takeovers or mergers, situations leading to removing a company from major stock exchanges due to bankruptcy, demergers or spinoffs, shifts in a company's domicile, or significant alterations in its organizational structure.
As a result of these regular and intra-quarter changes, an average of 25 to 30 stocks in the S&P 500 are replaced each year. This fluidity highlights the dynamic nature of the index and the constant shifts within the U.S. stock market. When looking at historical data, it becomes evident that the average lifespan of a company within the S&P 500 has significantly decreased over the years. For instance, in 1958, the average company's tenure in the index was an impressive 61 years. However, by 2021, this average had decreased significantly to only 16 years.
Furthermore, projections suggest that this trend of change and adaptation will persist. By 2027, about 75% of the companies listed on the index will have undergone significant transformations or disappeared altogether. These statistics emphasize the importance of agility and innovation in the corporate world, as companies must continuously evolve to remain competitive and relevant in an ever-shifting market landscape.
For investors, keeping a close watch on these changes in the S&P 500 is vital for making informed investment decisions. The index's frequent adjustments reflect the dynamism of the modern business world, and understanding this process is key to navigating the complexities of the stock market effectively.
The S&P 500 vs. Other Indices
As you learn about investing, you'll encounter a variety of stock market indices, each with its unique characteristics and areas of focus. These stock market indices serve distinct purposes and cater to different investment strategies.
The S&P 500 is a comprehensive representation of the U.S. stock market. Comprising 500 of the largest publicly traded companies in the United States, this index is meticulously designed to provide a broad snapshot of the country's economic performance. Investors seeking to track the performance of major U.S. corporations from various sectors often turn to the S&P 500. It is accessible through index funds, making it a popular choice among investors.
In contrast, the Dow Jones Industrial Average (DJIA) is a time-tested index that includes 30 large U.S. companies, primarily from the industrial sector. Unlike the S&P 500, the DJIA relies on a price-weighted methodology, where stocks with higher prices substantially influence the index's value. While the DJIA is one of the oldest and most watched indices globally, its smaller size may limit its ability to provide a comprehensive overview of the overall market.
The Nasdaq Composite, comprising over 3,000 stocks listed on the Nasdaq stock exchange, emphasizes technology and growth-oriented companies. It's often the go-to index for investors interested in the tech sector. However, the Nasdaq Composite can be more volatile than the S&P 500 due to its tech-heavy composition.
Beyond these primary indices, there are other options to consider. The Russell 2000 Index tracks 2,000 small-cap U.S. companies, offering the potential for higher growth but with increased volatility. The MSCI EAFE Index focuses on developed markets outside of North America, serving as an excellent choice for international diversification but carrying the risk associated with currency fluctuations. Lastly, the Bloomberg Barclays U.S. Aggregate Bond Index covers various U.S. bonds, providing income and stability, albeit typically with lower returns than equity indices.
Selecting the right index for your investment needs hinges on your objectives, risk tolerance and investment horizon. While the S&P 500 is often preferred for its broad representation, the other indices cater to specific tech-focused, internationally diversified, or income-generating strategies. It's essential to align your choice with your financial goals to make the most informed investment decisions.
S&P 500 Demystified: Your Investment Compass
The S&P 500 is your investment compass, helping guide and direct your investment. Beyond its numerical value, it represents a testament to economic resilience and corporate prowess. Mastering the intricacies of the S&P 500 is not an option but a necessity.
It serves as your compass, steering you through the complexities of the U.S. stock market. Unveil its secrets, leverage its insights and empower your investment choices. The S&P 500 encapsulates a benchmark and a blueprint for financial success, guiding you toward strategic and financial opportunities.
Before you consider Amazon.com, you'll want to hear this.
MarketBeat keeps track of Wall Street's top-rated and best performing research analysts and the stocks they recommend to their clients on a daily basis. MarketBeat has identified the five stocks that top analysts are quietly whispering to their clients to buy now before the broader market catches on... and Amazon.com wasn't on the list.
While Amazon.com currently has a Moderate Buy rating among analysts, top-rated analysts believe these five stocks are better buys.