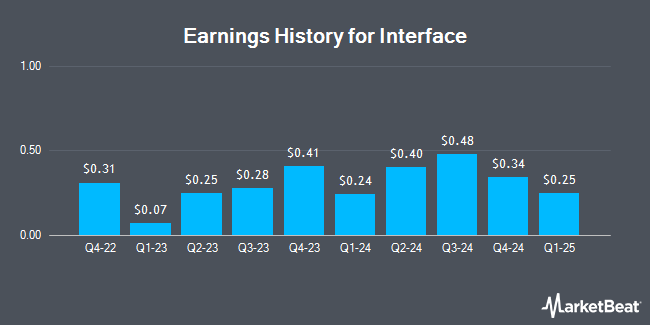
Interface (NASDAQ:TILE - Get Free Report) issued its quarterly earnings results on Friday. The textile maker reported $0.68 earnings per share for the quarter, beating the consensus estimate of $0.61 by $0.07, FiscalAI reports. Interface had a return on equity of 21.77% and a net margin of 10.10%. The company had revenue of $366.74 million during the quarter, compared to analysts' expectations of $377.60 million. During the same quarter in the prior year, the firm posted $0.61 earnings per share. The business's quarterly revenue was up .6% on a year-over-year basis.
Here are the key takeaways from Interface's conference call:
- Adjusted diluted EPS rose 11.5% to $0.68, while adjusted operating income increased 5.7%. Adjusted gross margin expanded 103 basis points to 40.6%, as pricing, mix, and manufacturing efficiencies more than offset higher costs.
- Demand indicators were broadly supportive: billings grew across healthcare, education, and corporate office, and Americas orders increased 6%. The company ended the quarter with backlog up 14% year to date.
- Interface lowered its full-year net sales outlook to $1.440 billion–$1.455 billion, citing softer European conditions; Q3 sales also came in slightly below the low end of guidance. EAAA orders declined 7% as opportunities took longer to convert.
- The company reaffirmed its full-year earnings outlook despite higher oil-related costs and new Canadian tariffs, estimated to add $5 million–$10 million annually. Management said pricing, productivity initiatives, and automation are helping offset cost pressures.
Interface Stock Down 18.7%
Shares of TILE stock traded down $7.08 on Friday, reaching $30.74. 1,862,459 shares of the company were exchanged, compared to its average volume of 521,792. The company has a debt-to-equity ratio of 0.29, a current ratio of 2.53 and a quick ratio of 1.35. The company has a 50-day moving average of $35.78 and a 200-day moving average of $32.30. The company has a market cap of $1.78 billion, a price-to-earnings ratio of 12.45, a PEG ratio of 1.13 and a beta of 2.08. Interface has a one year low of $24.40 and a one year high of $40.84.
Interface Announces Dividend
The business also recently disclosed a quarterly dividend, which was paid on Friday, September 18th. Stockholders of record on Friday, September 4th were given a dividend of $0.03 per share. This represents a $0.12 dividend on an annualized basis and a dividend yield of 0.4%. The ex-dividend date of this dividend was Friday, September 4th. Interface's dividend payout ratio is 4.86%.
Key Interface News
Here are the key news stories impacting Interface this week:
- Positive Sentiment: Adjusted earnings per share were $0.68, beating the $0.61 consensus estimate and rising 11.5% year over year. Interface Q3 Earnings Top Estimates
- Neutral Sentiment: Revenue edged up 0.6% year over year to $366.7 million, while GAAP diluted EPS was $0.67, down 14.1%. Interface Reports Third Quarter 2026 Results
- Negative Sentiment: Quarterly sales missed analysts’ $377.6 million estimate. Interface’s FY 2026 revenue guidance of $1.4 billion–$1.5 billion also falls short of the roughly $1.5 billion consensus at the midpoint, raising concerns about near-term growth. Interface Q3 Revenue Flash
Insider Activity at Interface
In related news, CEO Laurel Hurd sold 7,000 shares of the company's stock in a transaction that occurred on Monday, October 26th. The stock was sold at an average price of $36.42, for a total transaction of $254,940.00. Following the transaction, the chief executive officer directly owned 492,978 shares of the company's stock, valued at approximately $17,954,258.76. This represents a 1.40% decrease in their position. The transaction was disclosed in a filing with the Securities & Exchange Commission, which can be accessed through the SEC website. Also, VP David Foshee sold 28,451 shares of the stock in a transaction that occurred on Tuesday, September 8th. The stock was sold at an average price of $35.99, for a total value of $1,023,951.49. Following the completion of the transaction, the vice president owned 146,563 shares in the company, valued at approximately $5,274,802.37. The trade was a 16.26% decrease in their position. Additional details regarding this sale are available in the official SEC disclosure. Insiders sold 65,621 shares of company stock valued at $2,378,904 in the last three months. Corporate insiders own 2.47% of the company's stock.
Wall Street Analysts Forecast Growth
TILE has been the subject of a number of recent analyst reports. Zacks Research downgraded shares of Interface from a "strong-buy" rating to a "hold" rating in a research report on Friday, October 9th. Wall Street Zen cut Interface from a "buy" rating to a "hold" rating in a research note on Saturday, October 31st. Weiss Ratings downgraded Interface from a "buy (b+)" rating to a "buy (b)" rating in a report on Tuesday, October 27th. Finally, Barrington Research boosted their price target on Interface from $36.00 to $45.00 and gave the company an "outperform" rating in a research note on Monday, August 10th. Three investment analysts have rated the stock with a Buy rating and one has issued a Hold rating to the stock. According to data from MarketBeat.com, the company presently has a consensus rating of "Moderate Buy" and an average target price of $40.50.
View Our Latest Research Report on Interface
About Interface
(
Get Free Report)
Interface, Inc designs and manufactures modular flooring products for commercial, institutional and residential interiors. Its portfolio includes carpet tile, broadloom carpet and resilient flooring, including luxury vinyl tile. The company serves markets such as corporate offices, hospitality, education, healthcare and retail.
Founded in 1973 by Ray Anderson, Interface is headquartered in Atlanta, Georgia, and sells its products through a global network serving customers in North America, Europe and the Asia-Pacific region.
See Also
This instant news alert was generated by narrative science technology and financial data from MarketBeat in order to provide readers with the fastest reporting and unbiased coverage. Please send any questions or comments about this story to contact@marketbeat.com.
Before you consider Interface, you'll want to hear this.
MarketBeat keeps track of Wall Street's top-rated and best performing research analysts and the stocks they recommend to their clients on a daily basis. MarketBeat has identified the five stocks that top analysts are quietly whispering to their clients to buy now before the broader market catches on... and Interface wasn't on the list.
While Interface currently has a Moderate Buy rating among analysts, top-rated analysts believe these five stocks are better buys.
View The Five Stocks Here
Oil still powers the global economy, but AI is reshaping the energy opportunity. Discover seven stocks spanning traditional energy, infrastructure, and next-generation power.
Get This Free Report
Continue following MarketBeat
Add MarketBeat as your preferred source on Google to see our latest stories in your feed.
Like this article? Share it with a colleague.
Link copied to clipboard.
