Semiconductor manufacturer Advanced Micro Devices NYSE: AMD shares are been on fire since competitor Intel NASDAQ: INTC indicated a delay in developing its next-gen chips during their Q2 2020 earnings release. AMD shares collapsed with the S&P 500 index NYSEARCA: SPY during the pandemic plunge in February but has since blew through its $59.27 pre-COVID highs. The market believes AMD will benefit from Intel’s misstep as evidenced by the squeeze to all-time highs. For investors already positioned and those looking to get positions, the key question remains, where to from here? We will examine the technicals tempered by fundamental data to forecast key trajectories for investors on both sides of the fence.
Q2 FY 2020 Earnings Release
On July 28, 2020, AMD released its second-quarter fiscal 2020 results for the quarter ending June 2020. The Company reported earnings of $0.18 per share beating consensus analyst estimates of $0.17 per share by $0.01. Revenues grew 26.1% year-over-year (YoY) to $1.93 billion beating consensus estimates of $1.86 billion. The Computing and Graphics segment revenue was $1.37 billion, spiking 45% YoY driven by strong sales of Ryzen and EPYC chips. The increase in remote work and homeschooling was a boon to a strong PC market as AMD delivered the highest client processor revenues in 12-years with the 11th straight quarter of market share gains. There are 54 Ryzen 4000 processor-powered notebooks on the market and the second wave of more than 30 ultrathin premium laptops will be launching soon.
Raising Guidance
AMD raised Q3 2020 guidance on revenues to a range of $2.45 billion to $2.65 billion up from $2.3 billion consensus analyst estimates. Non-GAAP gross margins are expected to hit 45% YoY. The Company also raised full-year 2020 revenue to 32% YoY implying $8.88 billion in top line sales versus $8.39 consensus estimates. While the guidance raise was impressive, the EPS beat was basically in-line. Desktop GPU sales were down but offset by notebook and mobile. The real underlying strength was driven on the anticipated market share gain on Intel’s delays. AMD saw data center product revenues grow to 20% of overall sales and anticipates strong performance from second-generation EPYC processors. Microsoft NASDAQ: MSFT announced the addition of EPYC processors to power their Office Online cloud applications used by over 200 million monthly users. Similar wins include Alphabet NASDAQ: GOOG , Amazon NASDAQ: AMZN , and Oracle NASDAQ: ORCL all announcing the utilization of AMD server chips through its partnership with Hewlett Packard Enterprises NYSE: HPE offerings.
Wall Street Conference Catalysts
AMD is scheduled to attend several Wall Street conferences including Sept. 1st, Jeffries Virtual Semiconductor IT Hardware and Communications Infrastructure Summit, and Sept. 15th at the Deutsche Bank Technology Conference. However, the Q3 2020 quiet period starts after the close of Sept. 11, 2020. Jeffries upgraded the price target for AMD shares to $95 from $86 on Aug. 4, 2020.
AMD Versus Intel
The debate as to whether AMD is superior to Intel was swayed in AMD’s favor with its release of it 7nm laptop products housing eight cores while Intel’s 10nm Ice Lake chips were stuck at four-cores. While Intel rolled out six-core Ice Lake chips, the performance improvement was stifled by regressed frequencies and the 10nm chips have power issues preventing the addition of more cores. The workaround is the secret Tiger Lake chip which still retains four-cores but competes with AMD eight-core chips. Intel is striving for per-core performance (30% improvement per core) versus AMD’s method of stacking more core counts. Intel plans to launch Tiger Lake chips in September 2020.
AMD Price Trajectories
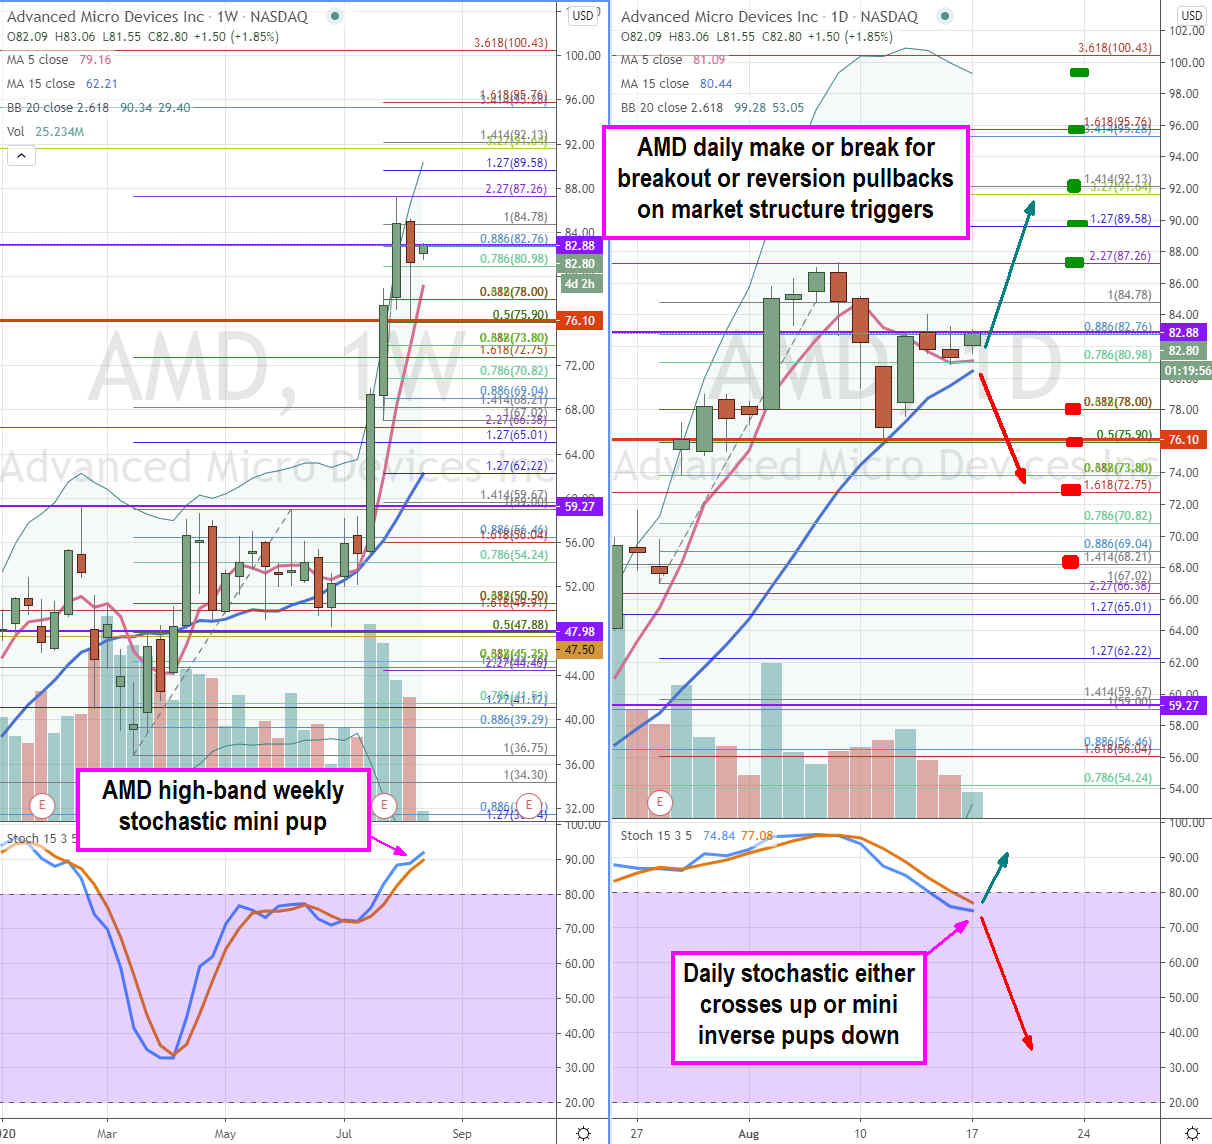
Using the rifle charts on the weekly and daily time frames provides a broader view of the landscape for AMD stock. The daily rifle chart triggers a market structure low (MSL) buy above $82.88. However, the weekly rifle chart triggers an opposite market structure high (MSH) sell trigger un $76.10. The daily is in a make or break that will be determined by the daily stochastic. If the daily stochastic crosses back up and triggers the daily MSL trigger, then upside trajectories sit at $87.26 Fibonacci (fib) level and previous high potential double top, $89.58 fib and weekly upper Bollinger Bands (BBs), $92.13, $95.78 fib and $99.28 daily upper BBs. If the daily stochastic slip back down forming a mini inverse pup then downside trajectories are at the $78.00 fib, $76.10 monthly MSH trigger, $72.75 fib and $68.21 fib.
There are catalysts that can trigger on announcements from Intel, China trade tensions as well as GPU competitor NVidia NASDAQ: NVDA earnings reaction.
Before you make your next trade, you'll want to hear this.
MarketBeat keeps track of Wall Street's top-rated and best performing research analysts and the stocks they recommend to their clients on a daily basis.
Our team has identified the five stocks that top analysts are quietly whispering to their clients to buy now before the broader market catches on... and none of the big name stocks were on the list.
They believe these five stocks are the five best companies for investors to buy now...
See The Five Stocks Here
Click the link to see MarketBeat's list of seven stocks and why their long-term outlooks are very promising.
Get This Free Report
Like this article? Share it with a colleague.
Link copied to clipboard.