Global enterprise software giant SAP SE NYSE: SAP has been scratching at all-time highs as its business gets lifted by artificial intelligence (AI) tailwinds. SAP is an acronym for Systems, Applications, and Products in Data Processing. The company provides cloud-based business software through its flagship enterprise resource planning (ERP) product.
This package integrates a comprehensive and synergistic range of business software, including accounting, human capital management (HCM), customer relationship management (CRM), project management, and procurement functions onto a single unified platform. The company custom tailors its software to meet the needs of each specific industry with AI and machine learning capabilities into their core applications.
SAP is a leader in the computer and technology sector, competing against multinational enterprise software giants like International Business Machines Co. NYSE: IBM, Microsoft Co. NASDAQ: MSFT, Salesforce Inc. NYSE: CRM and Oracle Co. NYSE: ORCL. Some of their major corporate clients include The Clorox Company NYSE: CLX, eBay Inc. NASDAQ: EBAY, NVIDIA CO NASDAQ: NVDA and Mondelez International Inc. NASDAQ: MDLZ.
30% of Deals in Q3 Involved AI Use Cases
SAP Today
$265.62 -10.17 (-3.69%) As of 10/10/2025 03:59 PM Eastern
This is a fair market value price provided by Polygon.io. Learn more. - 52-Week Range
- $225.67
▼
$313.28 - Dividend Yield
- 0.69%
- P/E Ratio
- 43.98
- Price Target
- $281.67
The updraft was certainly evident in its third quarter 2024 adjusted EPS growth of 6% YoY to $1.33, which beat analyst estimates by 2 cents on 9.4% YoY revenues growth to $9.17 billion, which also beat consensus estimates of $9.15 billion. The current cloud backlog rose 25% YoY to $15.38 billion. Cloud ERP Suite revenue rose 34% YoY to $3.67 billion. Cloud revenue rose 25% YoY to $4.35 billion.
The company has had ongoing cloud transformation transitioning clients for the past four years, and it's hitting its stride driven by AI. Buoyed by Gen AI Hub, nearly 30% of its cloud order entries in the quarter were deals that had AI use cases. SAP hit its goal of 100 AI use cases across its suite. AI consumption by SAP customers more than quadrupled in the quarter. SAP completed its $1.5 billion acquisition of digital adoption platform WalkMe.
Sustained Momentum Moving Ahead
SAP expects the momentum to remain steady moving forward. They bumped up their cloud and software revenue forecast by $433 million at the midpoint to $31.93 billion to $32.24 billion. Cloud revenue is expected to be between $18.41 billion to $18.73 billion, maintaining its previous forecast.
While SAP doesn't anticipate margin risks in 2025, it is speculative how AI activity may impact gross margins beyond 2025. However, the company believes AI will be margin accretive. The company has been very consistent in 2024 as the AI trend has been unwavering, which points to a strong Q4 2024.
SAP Forms an Ascending Triangle Pattern
An ascending triangle is comprised of a flat-top upper trendline resistance converging with an ascending (rising) lower trendline support. The breakout occurs when the stock surges through the upper trendline. If the stock collapses under the lower ascending trendline, then the pattern fails as a breakdown forms.
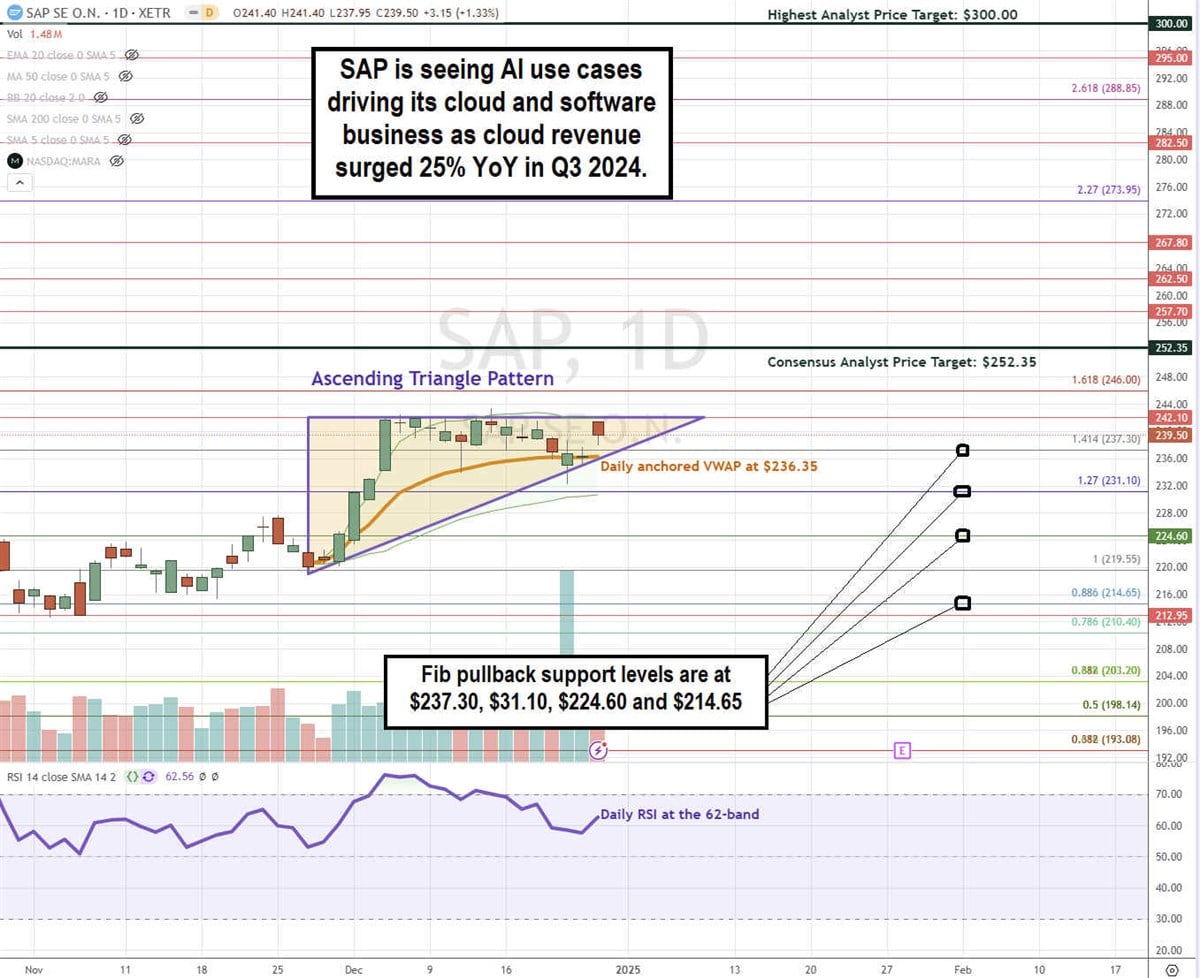
SAP formed the upper flat-top trendline resistance at $242.10 converging with the lower ascending trendline support which commenced around the $219.55 swing low. SAP tested the upper trendline resistance nearly eight times without managing to break out, and the ascending trendline was tested twice. The daily anchored VWAP support is at $236.35. The daily RSI is rising at the 62-band. Fibonacci (Fib) pullback support levels are at $237.30, $231.10, $224.60, and $214.65.
SAP's average consensus price target is $252.35, implying a 0.96% upside and its highest analyst price target sits at $300.00. It has eight analysts' Buy ratings and one Hold rating. The stock has a miniscule 0.11% short interest.
Actionable Options Strategies: Bullish investors can consider using cash-secured puts at the Fib pullback support levels to buy the dip. If assigned the shares, then writing covered call at upside Fib levels executes a wheel strategy for income on top of its 0.69% dividend yield.
Before you consider SAP, you'll want to hear this.
MarketBeat keeps track of Wall Street's top-rated and best performing research analysts and the stocks they recommend to their clients on a daily basis. MarketBeat has identified the five stocks that top analysts are quietly whispering to their clients to buy now before the broader market catches on... and SAP wasn't on the list.
While SAP currently has a Buy rating among analysts, top-rated analysts believe these five stocks are better buys.
View The Five Stocks Here
Enter your email address and we'll send you MarketBeat's list of ten stocks that are set to soar in Fall 2025, despite the threat of tariffs and other economic uncertainty. These ten stocks are incredibly resilient and are likely to thrive in any economic environment.
Get This Free Report
Like this article? Share it with a colleague.
Link copied to clipboard.