European banks delivered their best performance in years in 2025, and investors have been tempted to take profits during the sector’s recent pullback. But this rally is no bubble, and there’s plenty of evidence international bank stocks are still undervalued compared to their domestic peers.
European banks continue to average single-digit multiples while posting double-digit revenue growth, making the sector attractive amid sudden commodity tailwinds. But some stocks in the industry stand out more than others, and diversifying investments in this space will allow investors to capture different bullish factors.
Despite Commodity Headwinds, European Banks Are Still on Sale
European banks are still emerging as an undervalued industry after a decade of negative rates. The previous rate environment crushed bank margins, driving the European banking sector into a deep decline, which was further aggravated by war-induced commodity shocks. But now oil headwinds are shifting, and European banks benefit from a Goldilocks environment. And when markets are neither too hot nor too cold, investors tend to reap the rewards.
The European financial value shift isn’t just about oil, rates, and vibes; the sector has some very accommodative metrics that show certain stocks remain undervalued. Some of these metrics include:
Common Equity Tier 1 (CET1) Ratio - A metric used to measure a bank’s health by comparing its capital to its risk-weighted assets. A Goldilocks range is preferred for this metric: too high means capital is unproductive, too low means the bank is taking too much risk.
Return on Tangible Equity (ROTE) - Strips out factors like intellectual property and brand value to determine profit generated from capital invested by shareholders and is often considered the metric that best measures the pure performance of a bank’s capital.
Dividend Payout Ratio (DPR) - The percentage of a company’s earnings returned to shareholders as dividends. DPR is useful for gauging a bank’s financial health, as a dividend cut is often devastating to its outlook.
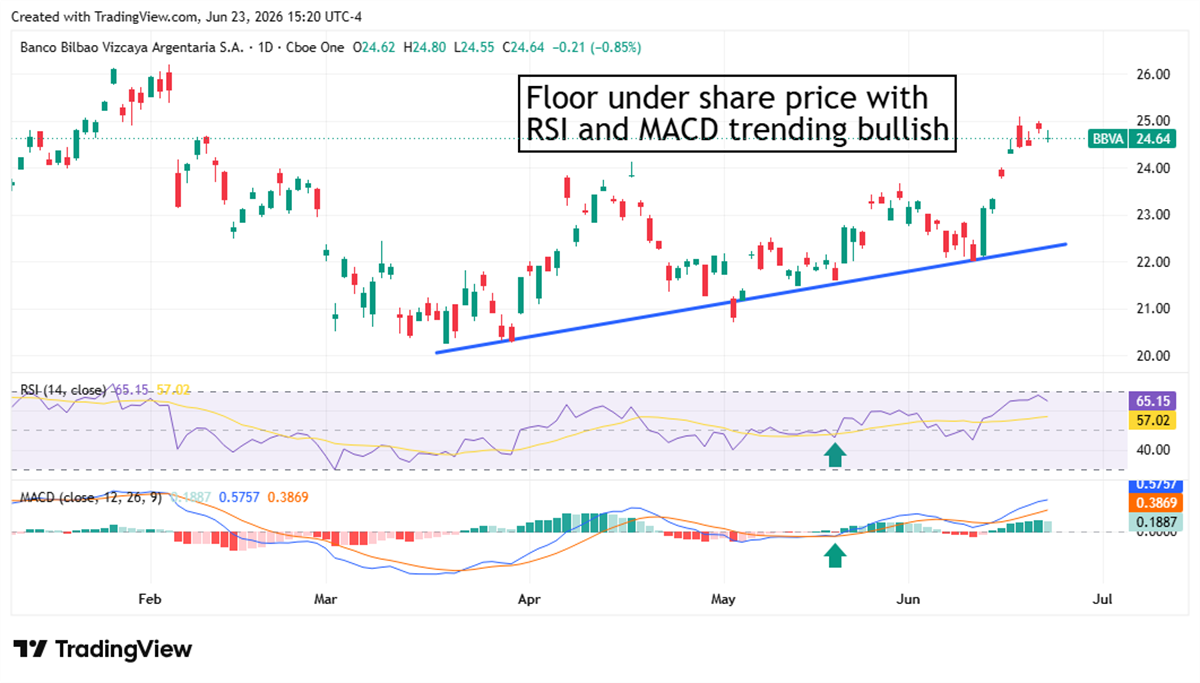
Banco Bilbao: The Profit Machine Keeps Churning
Banco Bilbao Viscaya Argentaria Today
BBVA
Banco Bilbao Viscaya Argentaria
$25.50 -0.17 (-0.64%) As of 02:28 PM Eastern
This is a fair market value price provided by Massive. Learn more. - 52-Week Range
- $14.63
▼
$26.40 - Dividend Yield
- 4.43%
- P/E Ratio
- 12.13
is one of the best-performing multinational banks in the Eurozone, thanks to its growth in emerging markets. The bank reported
ROTE of 21.7% and CET1 above 12% in Q1 2026, yet trades at around 10.3 times forward earnings. The dividend pays 4.63% with a
54.3% DPR, but the company is aggressively buying back shares, and net interest income was up more than 20% year-over-year (YOY).
BBVA shares bounced off a clear short-term low and have now resumed their upward momentum. The stock price continues to make higher lows, and a pair of momentum indicators has confirmed the uptrend. The Relative Strength Index (RSI) is above 50, a commonly recognized bullish threshold, and the Moving Average Convergence Divergence (MACD) has been trending upward since mid-May. BBVA’s technical uptrend matches its fundamental strength, which is why it ranks at the top of today’s list.
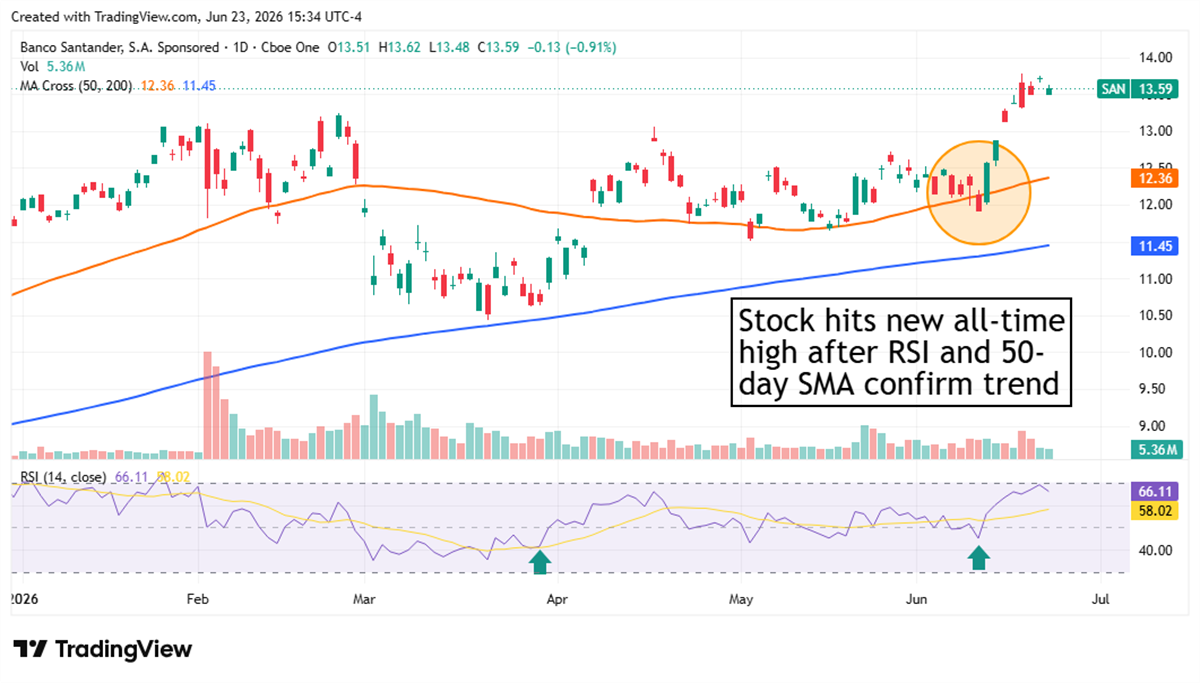
Santander: Capital Compounder Still Undervalued
Banco Santander Today
SAN
Banco Santander
$13.82 +0.20 (+1.43%) As of 02:28 PM Eastern
This is a fair market value price provided by Massive. Learn more. - 52-Week Range
- $8.29
▼
$14.39 - Dividend Yield
- 1.52%
- P/E Ratio
- 11.43
has surged nearly 65% over the last 12 months, but the Iran war briefly thwarted its bid to reach all-time highs. However, Santander retains a superb 15% ROTE with a CET1 of 14%, and its banking offerings are more globally diversified than BBVA. The stock isn’t a bargain like it was in
previous months, but the 1.57% dividend has an approximately
17% DPR and the stock trades at just 11 times earnings.
SAN shares challenged the 200-day moving average earlier this year, but the bullish uptrend proved strong enough to weather the storm. The stock price quickly surged back above the 50-day moving average, a move backed by the RSI’s ascension into bullish territory. The latest attempt to test the 50-day was swiftly rejected (and confined by the RSI), so SAN shares have the all clear to make more all-time highs.
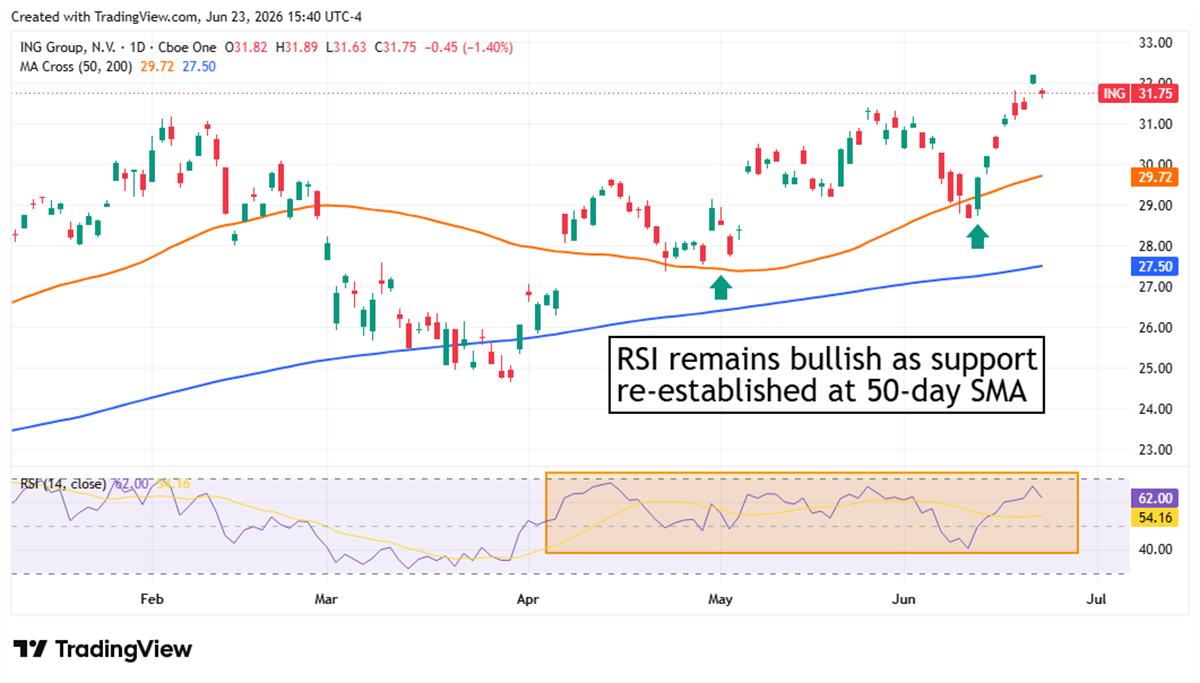
ING Group: Higher Risk Package With Income and Value
ING Group Today
$33.30 +0.56 (+1.69%) As of 02:28 PM Eastern
This is a fair market value price provided by Massive. Learn more. - 52-Week Range
- $22.40
▼
$33.31 - Dividend Yield
- 4.38%
- P/E Ratio
- 13.17
Amsterdam-based
ING Group N.V. NYSE: ING appears to be affordable at 11 times earnings, but its 16% CET1 and
57% DPR make it the bank with the most mismatched risk profile on our list. However, a 4.7% yield is hard to ignore for a bank stock trading at about 11.4 times forward earnings, and management raised net interest income (NII) guidance in the
last earnings report.
The RSI has been the guiding light during the volatile period, directing investors toward gains as the underlying share price fluctuated. Despite a brief June dip, the dependable momentum indicator has remained above 50, demonstrating that buyers have yet to relent. The 50-day moving average also remains a viable support tier, expressing even more bullish sentiment as the stock makes new all-time highs.
Before you consider Banco Bilbao Viscaya Argentaria, you'll want to hear this.
MarketBeat keeps track of Wall Street's top-rated and best performing research analysts and the stocks they recommend to their clients on a daily basis. MarketBeat has identified the five stocks that top analysts are quietly whispering to their clients to buy now before the broader market catches on... and Banco Bilbao Viscaya Argentaria wasn't on the list.
While Banco Bilbao Viscaya Argentaria currently has a Hold rating among analysts, top-rated analysts believe these five stocks are better buys.
View The Five Stocks Here
Nuclear energy is entering a new growth cycle as rising power demand, expanding data centers, and renewed policy support bring the sector back into focus. After strong gains in recent years, the most impactful phase of nuclear investment may still be ahead.
This report highlights seven nuclear energy stocks positioned across the value chain—combining near-term revenue with long-term upside as next-generation technologies scale. Click the link below to unlock the full list.
Get This Free Report
Like this article? Share it with a colleague.
Link copied to clipboard.