Supply and demand drives stock prices. When a stock rises, it implies more buying demand, driving up the price as it outstrips supply. When a stock falls, more supply drives down the price as buying demand dries up. Volume is the truth serum for breakouts and breakdowns. When a stock accumulates, it means shares have been bought up, and the opposite holds when a stock is being distributed, meaning it has been sold off.
An indicator that visualizes the accumulation and distribution utilizing both price and volume is called the accumulation distribution indicator. This article will review the accumulation distribution indicator, elaborate on what it does, and show how to use it. By the end of this article, you can add another useful chart indicator to your arsenal for trading and investing.
What is the Accumulation/Distribution (A/D) Indicator?
A chart indicator can help you assess if a stock is being accumulated or distributed. The accumulation distribution indicator (A/D) is a technical chart momentum indicator that may suit your needs. This momentum indicator, created by stock market analyst Marc Chaikin, utilizes price and volume to project the money flow into and out of a stock.
A rising A/D line indicates buying, which indicates rising money flow. It means there's more money flowing into the stock than is flowing out. A falling A/D line indicates selling, meaning that money flow is falling and more money flows out of the stock than in. Distribution and accumulation refers to stock movement. However, there are times when the stock price may rise, but the A/D line falls.
The accumulate distribute indicator also provides insight into the strength of a trend based on its volume, uptrend or downtrend. When the accumulation/distribution indicator line rises with an uptrend, it confirms that the uptrend is strongly supported by sufficient money flow.
The same vice versa in downtrends when the A/D line falls with the stock price. It indicates that the downtrend is supported by the money flowing out of the stock. When the A/D line starts to fall while the stock is uptrending, this is called a divergence. It implies that while the stock price is rising, the accumulation volume and money flow may not be strong enough to support it. This can be an early signal for a potential stock price reversal back down. On the flip side, if a stock is downtrending, but the A/D line is rising, it's a sign that the distribution volume is drying up, possibly signaling a stock price reversal.
Two important components occur before applying the accumulation/distribution indicator formula. The money flow multiplier (MFM) is derived from three components: The close is the stock's closing or last trade price for the period. The high is the highest price of the stock for the period. The low is the lowest price of the period. Once you have those figures, then, apply the money flow multiplier formula:
MFM = [(close - low) – (high - close)] / (high - close)
Once calculated, the MFM will range between -1 and +1. A positive MFM is a sign of buying pressure. The closer it is to +1, the stronger the buying pressure. A negative MFM is a sign of selling pressure. The closer it gets to -1, the stronger the selling pressure.
The next component is the accumulation distribution line (ADL), comprising three pieces of data. The previous ADL is the ADL value for the previous period. The MFM value for the current period is needed, as calculated earlier. The final component is the trading volume for the current period. The ADL formula is calculated as:
ADL = previous ADL + (MFM x volume)
The ADL cumulatively measures buy and selling pressure over time. The steeper the upward slope indicator, the more buying pressure or accumulation. The steeper the downward slope indicates more selling pressure or distribution.
What Does A/D Tell You?
The accumulation distribution indicator is a cumulative chart indicator using price and volume data to discern whether a stock (or any financial asset) is being accumulated or distributed. All historical data is calculated cumulatively, contrasted to rolling indicators like a simple moving average, where older data is dropped from the calculation to refresh with a more current moving average value. The A/D indicator is displayed as a line on a stock chart that oscillates with the stock price, illustrating the money flow in and out.
The accumulation deceleration indicator line provides much information, including identifying bullish and bearish trends and potential reversal signals. Price and indicator divergences can help identify an early reversal signal.
The angle of the A/D line also indicates the strength of the uptrend or downtrend. A steep rising A/D line indicates a strong trend and applies to a steep falling A/D line, indicating a strong downtrend. It is worth noting that the A/D indicator is a cumulative indicator that is most effective with more data and, thus, best used with wider time frames. While it can work with the heavy volume of large-cap stocks and lighter volume trading penny stocks, it's most effective with large-cap and blue-chip stocks since there is more volume data.
How the A/D Indicator Works
The A/D indicator works by comparing the closing trade price of the stock to the high and low prices on the day to determine accumulation vs. distribution at any point in the day. A rising A/D line and stock price indicate that buying pressure is stronger than selling pressure. A falling A/D line and stock price indicate that selling pressure is stronger than buying pressure in the stock.
The A/D line is a momentum oscillator, so it has its chart instead of a price indicator that would overlap on the price chart. The X-axis has the date, and the Y-axis shows the volume. However, don't make the mistake of wrongly assuming the Y-axis volume is the actual volume of the stock. It is not the stock volume as represented by volume bars. The Y-axis is the cumulative money flow volume.
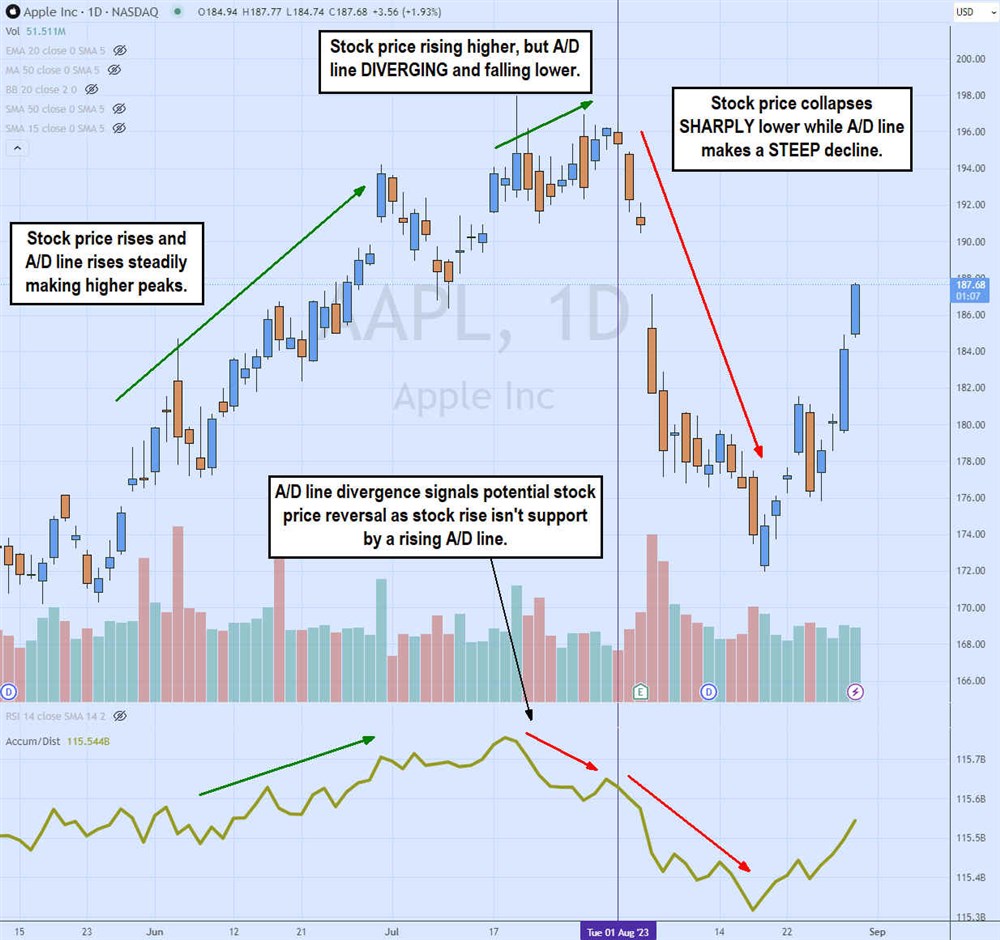
The candlestick chart of Apple Inc. NASDAQ: AAPL illustrates that the rising A/D line is supporting the stock price uptrend. Note that the A/D line is rarely a straight line but a choppy, curvy line. It's important to watch the overall trend of the A/D line.
If it's making higher peaks, then it's showing accumulation. If it's showing lower peaks, then it's a sign of distribution. As AAPL's price rises, it spikes up through $198. At this point, the A/D line hits its highest peak and starts to descend. While AAPL stock also initially sells off, it starts to climb back up, as evidenced by the green arrow indicating a rising body high.
Meanwhile, the A/D line continues to fall lower, indicating divergence. As AAPL stock peaks at $196 (vertical black trendline), the slope of the A/S line steepens as it falls hard. The stock also illustrates a sharp and steep sell-off from $196 to a low of $171.96. The stock bounces off that low just as the A/D line bounces sharply from the low.
How to Use the A/D Indicator
Now that you understand the accumulation distribution meaning, the question of how to use and apply the indicator is the next step. The A/D line can confirm the money flow into a stock supporting the uptrend when both the stock and the accumulation and distribution indicator steadily rise. It can help you maintain a long position with the uptrend or even provide a pullback signal to step into a trade to ride the uptrend.
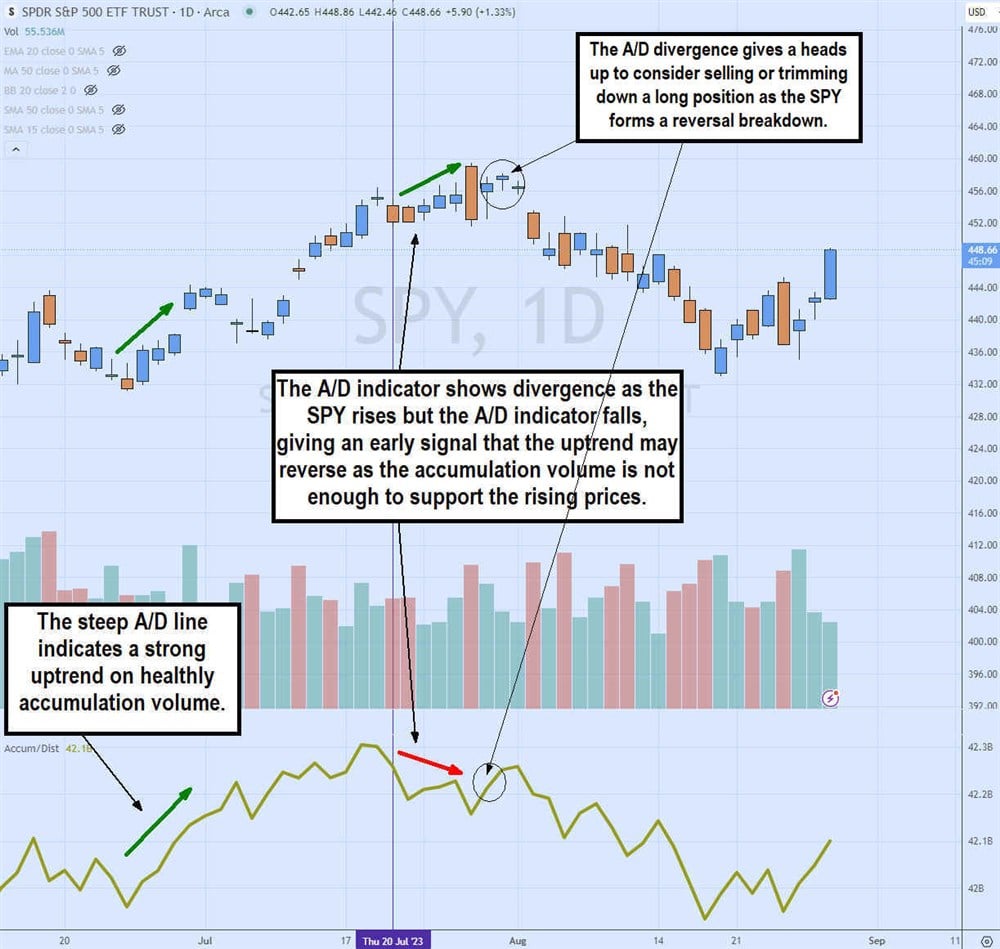
A divergence signal alerts you to be ready to trim or sell your position since the money flow indicates distribution despite the rising stock price. It helps you sell into the strength. A falling A/D line can trigger you to consider short-selling the stock if you are seasoned and well-versed in the risky art of short selling.
Example of Using the A/D Indicator
Let’s take an example of a use case for the A/D indicator. Let’s use Amazon.com Inc.'s NASDAQ: AMZN weekly candlestick chart to find a buy-long signal using the A/D indicator.
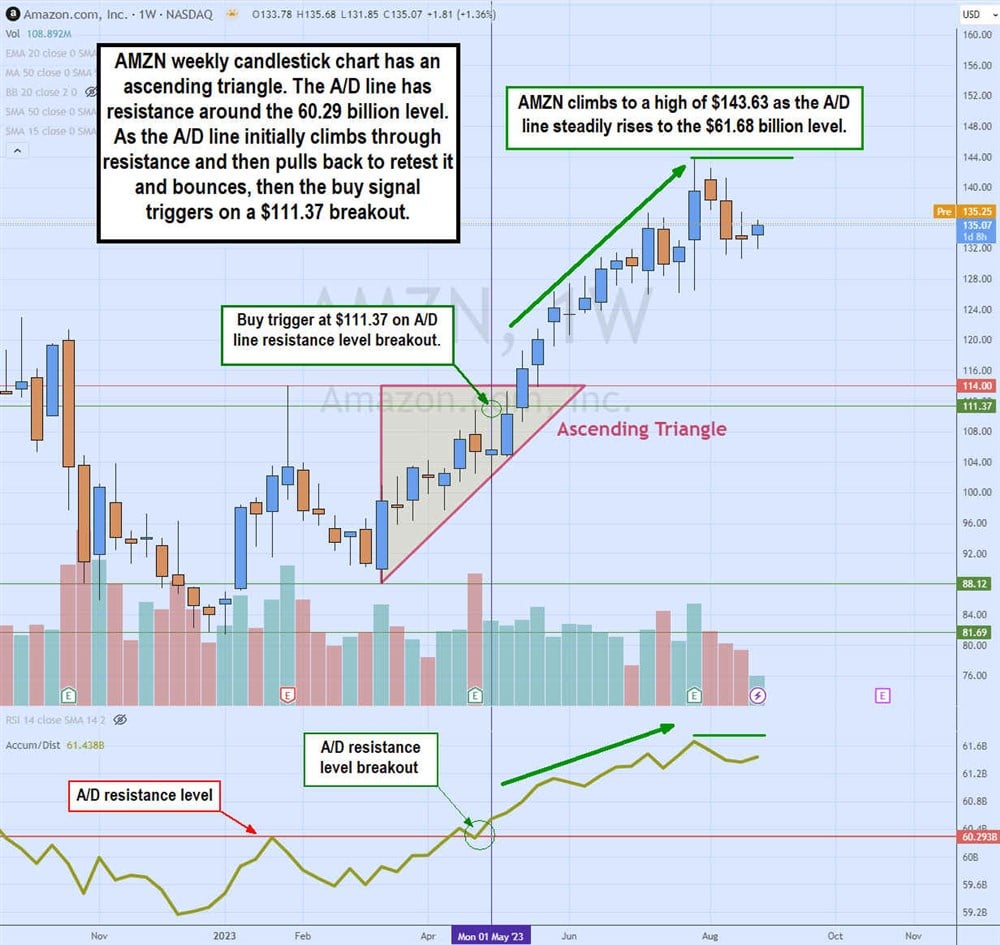
The AMZN weekly candlestick chart shows that the A/D line peaked at 60.29 billion as shares hit $114 in January 2023. That top helped to form a weekly ascending triangle pattern with the $114 as the flat-top trendline resistance. The bottom of the triangle was $88.12, made in March 2023. AMZN made higher lows on pullbacks, forming the ascending triangle as it slowly crept back up toward the $114 resistance level.
The A/D line also crept back up to break through the prior resistance level at 60.293 billion and then retested it on a quick pullback and bounce. The buy trigger was $111.37 as AMZN successfully formed a breakout through the $114 resistance. The A/D line continued to grind higher, indicating stock accumulation, as money flowed into AMZN, indicating a strong uptrend. AMZN shares climbed as high as $143.63 before peaking out. The A/D line also peaked at 61.684 billion, indicating distribution volume gained as money flowed from the stock.
Pros and Cons of Using A/D
There are upsides and downsides to using the accumulation/distribution indicator.
Pros
Here are some of the benefits of using the A/D indicator:
- Simple indicator: It is a simple indicator to understand and use. The A/D indicator is pretty straightforward. If the A/D line rises, it indicates accumulation and rising money flow, driving shares higher and vice versa. Pay attention when the A/D line and the stock price diverge, as it can signal an impending reversal.
- Potential trend reversals: You can use it to identify potential trend reversals. Trend reversals happen because the accumulation turns into distribution as money flows and starts to flow out of the stock. The divergences are often a precursor to an imminent trend reversal forming.
- Complement chart indicators: You can use it to complement other chart indicators. The A/D can confirm other chart indicators and chart patterns. The weekly candlestick chart with AMZN formed the weekly ascending triangle as shares rose toward the $114 flat-top resistance. Still, the A/D line breakout through the prior resistance of 60.293 billion triggered a buy signal at $111.37 before the breakout, which eventually rose to a high of $143.64.
Cons
Here are some of the downfalls of using the A/D indicator:
- Laggard indicator: The A/D indicator is a laggard indicator. Since the A/D line comprises historical data, it usually works as a confirmation rather than a predictive tool. Although the divergence can provide a heads-up on a potential trend reversal, it's not always accurate as many times the A/D indicator will be lagging the price rise. Like the moving average, which uses historical price data over time, the A/D indicator also uses historical data.
- Wider time frames: The A/D indicator works better on wider time frames. Since the A/D line can seem choppy rather than oscillate smoothly, it works best over a longer period. Weekly charts are smoother than daily or intraday charts with the A/D indicator. Using those shorter time frames is possible, but it is best to use them in conjunction with other complementary indicators.
- False signals: Just like any indicator, nothing is perfect. The A/D indicator can sometimes form false signals, especially when there is a sudden jolt of volume, like an unexpected news event. When volume surges hard and then falls back to normal, it can sometimes cause a false divergence signal but will eventually smooth out with more time and data.
Adding Complementing Indicators
While the accumulation/distribution indicator is useful, you shouldn't use it or rely on it alone. Rather, you should use it with other indicators to help confirm chart pattern set-ups.
The A/D line is a momentum indicator that helps to confirm trends. It helps to have a price indicator like moving averages and/or Bollinger Bands in addition to using chart pattern set-ups. It is also helpful to have another momentum indicator like the relative strength index (RSI) to help gauge oversold and overbought conditions to better assist in entries and exits. A complete arsenal should consist of chart indicators that suit your needs, but be careful not to overload your charts with too many indicators. Consider having two price indicators and two momentum indicators when doing chart analysis.
Before you consider Amazon.com, you'll want to hear this.
MarketBeat keeps track of Wall Street's top-rated and best performing research analysts and the stocks they recommend to their clients on a daily basis. MarketBeat has identified the five stocks that top analysts are quietly whispering to their clients to buy now before the broader market catches on... and Amazon.com wasn't on the list.
While Amazon.com currently has a Moderate Buy rating among analysts, top-rated analysts believe these five stocks are better buys.
View The Five Stocks Here
Just getting into the stock market? These 10 simple stocks can help beginning investors build long-term wealth without knowing options, technicals, or other advanced strategies.
Get This Free Report
Like this article? Share it with a colleague.
Link copied to clipboard.