Stock market sectors represent a general field of business and companies. The sectors are further filtered based on principal businesses, common products, services, practices and themes.
It’s worth taking an in-depth look at stock market sectors to help guide your investment strategy. We’ll explore each stock market sector, walk through a few of the largest and well-known companies within each sector as well as various industry groups. You’ll likely recognize many of the names — the most well-known brands in the world tend to lead their respective stock sectors.
What Are Stock Market Sectors?
The stock market is like an ocean of over 6,000 stocks moving simultaneously throughout the day. Rather than trying to track each stock individually, the Standard and Poor’s (S&P), Dow Jones Indices and MSCI developed the Global Industry Classification Standard (GICS) in 1999 as a way to track groups of stocks. These groups are organized into general categories known as stock market sectors.
Within the sectors are industry groups, which then are split into industries and then further divided into sub-industries. These classifications make it easier to track, compare and organize the performance of not only the companies within the categories but also the categories themselves. All publicly listed companies should fall into one of the 11 stock market sectors but only the major public companies are actually tracked and officially placed into the sectors and industries.
These market sectors help to comprise benchmark indices such as the S&P 500 Index, which is a widely accepted measure of the performance of the stock market and the economy. The S&P 500 contains the largest and most dominant businesses in the country.
How Many Sectors Are in the Stock Market?
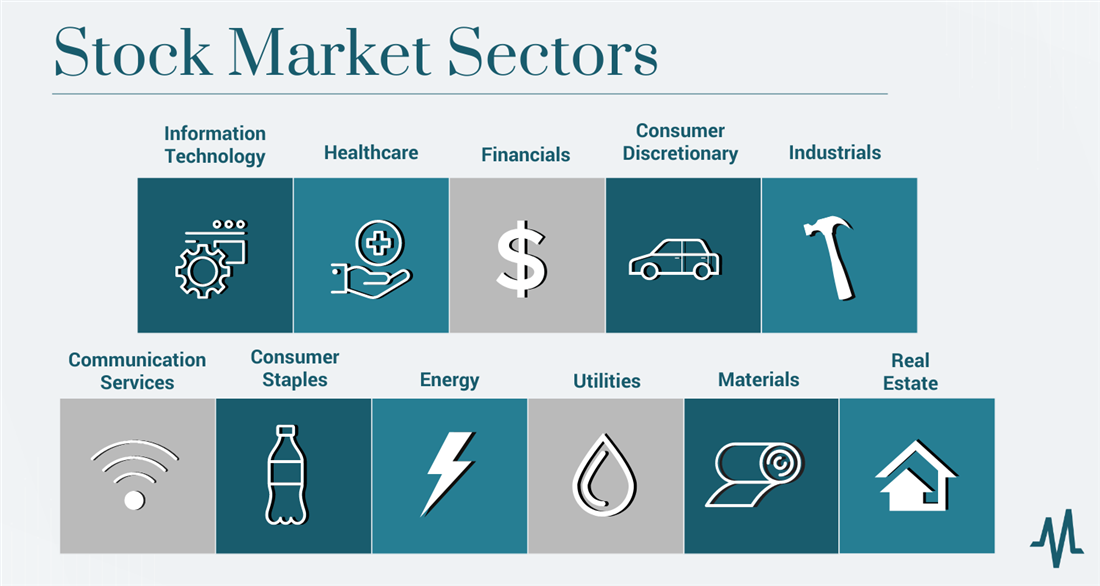
There are 11 sectors of the stock market. Within the sectors, there are 24 industry groups, 69 stock market industries and 158 sub-industries that encompass all major publicly listed companies. While this can seem overwhelming at first, there is a method to the madness — many of the companies are household names and brands.
11 Stock Market Sectors: List and Explanation
Now that you have an understanding of stock market sectors, let’s delve into each of the 11 stock market sectors and their characteristics as well as some of the major public companies that fall into them. We will list the sectors by weighting in the S&P 500 Index, or the percentage that the sector “takes up” on the S&P 500 based on market capitalization.
Information technology, or the technology or tech sector, encompasses the largest weighting in the S&P 500 index. Technology companies make the hardware and software necessary to provide computer and internet-related services. The information technology sector has three industry groups: Software and services, technology hardware and equipment and semiconductor and semiconductor equipment.
These potentially volatile stocks are suited for investors with a high tolerance for risk. Some of the heaviest weighted companies in this sector include Apple Inc. (NASDAQ: AAPL), Microsoft Corporation (NASDAQ: MSFT) and semiconductor maker Intel Corporation (NASDAQ: INTC).
2. Health Care
The health care sector comprises businesses that provide medical care and services, produce medical equipment or drugs or provide medical insurance and treatments to patients. The sector includes two industry groups: health care equipment and services and pharmaceuticals, biotechnology and life sciences.
Some of the largest holdings in our list of health care stocks include UnitedHealth Group (NYSE: UNH), Johnson & Johnson (NYSE: JNJ) and pharmaceutical giant Eli Lilly and Company (NYSE: LLY).
3. Financials
The financial sector comprises firms and institutions that provide financial products and services to individuals and businesses. There are three industry groups within the sector, including banks, diversified financials and insurance.
Some of the largest companies in the sector include JP Morgan Chase & Co. (NYSE: JPM), Bank of America (NYSE: BAC) and insurer Allstate Corporation (NYSE: ALL).
4. Consumer Discretionary
The consumer discretionary sector consists of companies that sell nonessential products and services that consumers purchase with excess cash. If you ever wonder about consumer discretionary stocks, just remember that they sell products that bring fun and enjoyment but aren’t necessities. Individuals often make these purchases for pleasure but can live without them during tough economic times. This sector is especially sensitive to economic cycles. When economies are strong, the consumer discretionary sector tends to make more discretionary purchases (and vice versa) during weak economies. This sector comprises four industry groups: automobiles and components, consumer durables and apparel, consumer services and retailing.
Some of the major companies in this sector include NIKE Inc. (NYSE: NKE), Starbucks Corp. (NASDAQ: SBUX) and The Home Depot Inc. (NYSE: HD).
5. Industrials
The industrials sector makes up companies that manufacture and distribute capital goods, supplies, equipment and products that enable other companies to operate their businesses. This sector includes transportation, capital goods and commercial and professional services.
Some of the more well-known names include aerospace giant The Boeing Company (NYSE: BA), heavy machinery manufacturer Caterpillar Inc. (NUSE: CAT) and General Electric (NYSE: GE).
6. Communication Services
Companies in this sector provide products and services that enable individuals to communicate with each other on a global scale. This is a new sector that also includes former technology companies originally in the information technology sector. This sector includes telecommunication services and media and entertainment.
Some of the largest companies in this sector include social media giant Meta Platforms Inc. (NASDAQ: META), wireless carrier T-Mobile U.S. Inc. (NASDAQ: TMUS) and entertainment giant The Walt Disney Company (NYSE: DIS).
7. Consumer Staples
The consumer staples sector comprises companies that provide essential products and services that people need in their daily lives. They provide the necessities. Tough economic climates are ideal times to learn more about consumer staples.
This sector includes three industry groups: food and staples retailing, food, beverage and tobacco; and household and personal products. Some of the larger companies include Costco Wholesale Corporation (NASDAQ: COST), Hormel Foods Corporation (NYSE: HRL and The Kraft Heinz Company (NYSE: KHC).
8. Energy
The energy sector includes companies that explore for, produce, generate, refine or transport consumable fuels. These are companies in the business of selling energy. There are no industry groups.
Some of the most recognized names include Exxon Mobil Corporation (NYSE: XOM), oil refinery Valero Energy Corporation (NYSE: VLO) and Halliburton Company (NYSE: HAL).
Learn more: Top 50 Energy Stocks
9. Utilities
This sector includes companies that provide basic amenities and essential services like electricity, natural gas, water, sewage and waste disposal. These stocks tend to be some of the least volatile in the market and tend to pay steady dividends. They are considered conservative investments for low-risk-tolerant investors often seeking to earn income over growth.
Some of the most well-known stocks include Duke Energy Corporation (NYSE: DUK), Pacific Gas & Electric Company (NYSE: PCG) and Exelon Corp. (NYSE: EXC).
10. Materials
Companies that explore for, develop and process raw materials make up the materials or basic materials sector. Commodities such as coal, lumber, steel, precious metals and chemicals are essential building blocks to manufacture everyday items.
Some of the larger companies include International Paper Company (NYSE: IP), Newmont Corporation (NYSE: NEM) and paint and coatings maker Sherwin-Williams Company (NYSE: SHW).
11. Real Estate
The real estate sector consists mostly of companies that own, sell, lease, build, develop, operate and/or manage property. These businesses can range from homebuilders and construction companies to brokers and office management companies and landlords. Many of these companies are structured as real estate investment trusts (REITs) that operate like pass-through companies paying out a monthly distribution as they manage income-generating properties like office buildings, strip malls and warehouses.
Some of the larger real estate companies include malls and office buildings Simon Property Group (NYSE: SPG), Vornado Realty Trust (NYSE: VNO) and Realty Income (NYSE: O).
How to Invest in Stock Market Sectors
If you want to invest in stock market sectors,you have a number of options at your disposal. After researching the sectors you wish to invest in, you can select your investing method. Keep the risks in mind with each method as well as the volatility involved with each sector.
Option 1: Buy individual stocks in the sector.
The notion of putting all your eggs into one basket comes to mind when buying individual stocks, which means you’ll have to do your research before you invest. Individual stocks carry higher risk since any sector specific news or event can impact prices. Individual stocks involve very little hedging, as they are directional bets with only one direction — long. Higher-quality stocks often have the largest market capitalizations and are the most widely owned.
These stocks are often components in the benchmark S&P 500 index and have the advantage of heavy liquidity, which results in less slippage when purchasing. The only real way to hedge involves diversifying into multiple stocks within the sector but across different industry groups to spread the risk.
Option 2: Buy sector mutual funds.
Under the same thinking of diversifying risk by owning multiple companies within the sector, you can also select a sector-themed mutual fund. These are professionally managed both passively and actively, depending on the theme. Mutual funds allow you to own many positions in the sector so that a single stock disaster won’t hurt as much with the risk spread out. The downside of mutual funds include the lack of transparency when buying or selling since you don’t know the price until after the close.
Option 3: Buy sector ETFs.
You can also buy an exchange-traded-fund (ETF), which trades like a stock but which offers full transparency. You know what it’s trading at, the spreads and the price at which your position was bought or sold instantly. Like an individual stock, you can buy ETFs and sell them multiple times in a day. Like a mutual fund, they own or track multiple names (if not all names) within a sector to spread out risk through diversification.
True diversification would entail buying ETFs in different sectors. For example, the information technology sector tends to be weak during periods of high inflation, but the health care sector tends to fare well when technology stocks tumble. By owning ETFs in both sectors, you could partially hedge your bets.
How to Include All Sectors in Your Investment Portfolio
Rather than invest in individual stocks or sectors through exchange traded funds (ETFs), you can actually invest in all sectors simultaneously by buying the actual benchmark S&P 500 Index. This doesn’t mean buying each of the 500+ names. Instead, you can purchase an ETF that owns all the component stocks in the index trading under the stock symbol SPY. The S&P 500 Index ETF Trust (NYSEARCA: SPY) is extremely liquid, as it tracks the most heavily traded futures contract in the world, the S&P 500 futures and e-minis.
Understanding Sectors Can Help You Invest
“A rising tide lifts all boats” is a common saying in the stock market. When there is particular buying strength in a sector, it tends to lift the component stocks along with it. It’s a good idea to understand the sectors showing relative strength and weakness when you are more selective with your investing. Sectors analysis also provides an indication of which parts of the economy fare better than others.
