Free Trial

Real Estate Stocks List

This page shows information about the 50 largest real estate sector stocks including Welltower, Prologis, Equinix and American Tower.

Welltower stock logo

1. Welltower NYSE:WELL

$247.12 -0.54 (-0.22%)
Closing price 11/11/2026 03:59 PM Eastern
Extended Trading
$247.70 +0.59 (+0.24%)
As of 08:52 AM Eastern
Extended trading is trading that happens on electronic markets outside of regular trading hours. This is a fair market value extended hours price provided by Massive. Learn more.

Welltower Inc (NYSE:WELL), a real estate investment trust ("REIT") and S&P 500 company headquartered in Toledo, Ohio, is driving the transformation of health care infrastructure. More about Welltower

Pros of Welltower

  • Welltower Inc. recently reported strong third-quarter earnings, beating analyst expectations with an earnings per share of $1.67 compared to the consensus estimate of $1.64, while revenue grew 38.4% year-over-year to $3.72 billion, demonstrating robust operational performance and demand for its healthcare real estate assets.
  • Analyst sentiment has turned increasingly positive, with UBS Group raising its price target to $289.00 and JPMorgan Chase & Co. lifting its target to $273.00, both maintaining buy or overweight ratings, which suggests significant potential upside from the current stock price of $247.12.
  • The company is actively expanding its portfolio in high-growth markets, recently acquiring five nursing homes in South Florida for approximately $208 million and a rehab and nursing home in Broward County for at least $49 million, signaling continued strategic growth in the senior housing sector.

Cons of Welltower

  • The stock is trading at a high valuation with a P/E ratio of 106.98, which is significantly above the market average, indicating that investors are paying a premium for earnings that may not be sustainable if growth slows or if the company fails to meet its raised guidance.
  • Despite strong earnings, the stock faced a sell-off following the recent earnings release, dropping to $227.90 from a previous close of $240.61, suggesting that the market may be skeptical about the company's ability to execute on its improved outlook and maintain its growth trajectory.
  • Some analysts have expressed caution, with Weiss Ratings lowering its rating from "buy" to "hold" and Barclays reducing its price target to $246.00 with an "equal weight" rating, reflecting concerns about the stock's valuation and potential for limited near-term upside.
A.I. GeneratedThese insights were generated using artificial intelligence. They are based on proprietary MarketBeat data, news articles, and custom LLM A.I. algorithms.
Market Capitalization
$181.69 billion
P/E Ratio
106.98
Consensus Rating
Moderate Buy
Consensus Price Target
$263.10 (+6.5% Upside)
Volume
2.68 million shares
Average Volume
3.12 million shares
Today's Range
$243.80
▼
$247.41
50-Day Range
$221.18
▼
$247.90
52-Week Range
$181.47
▼
$255.20
Dividend Yield
1.37%
Prologis stock logo

2. Prologis NYSE:PLD

$130.07 -0.03 (-0.02%)
Closing price 11/11/2026 03:59 PM Eastern
Extended Trading
$129.50 -0.57 (-0.44%)
As of 08:52 AM Eastern
Extended trading is trading that happens on electronic markets outside of regular trading hours. This is a fair market value extended hours price provided by Massive. Learn more.

Prologis, Inc is the global leader in logistics real estate with a focus on high-barrier, high-growth markets. At March 31, 2024, the company owned or had investments in, on a wholly owned basis or through co-investment ventures, properties and development projects expected to total approximately 1.2 billion square feet (115 million square meters) in 19 countries. More about Prologis

Pros of Prologis

  • Prologis, Inc. recently reported a significant earnings beat in its Q3 2026 results, delivering an actual EPS of $1.60 compared to a consensus estimate of $0.777, which demonstrates strong operational performance and the ability to exceed market expectations during a period of economic uncertainty.
  • The company has maintained a consistent "Moderate Buy" consensus rating from analysts, with a current average price target of $154.52, suggesting that the current stock price of $128.70 offers a substantial upside potential of nearly 20% for investors looking to capitalize on the firm's growth trajectory.
  • Prologis, Inc. is benefiting from a strategic shift in logistics demand, as a recent survey indicates that 91% of company leaders believe retailers and logistics providers urgently need more decentralized fulfillment networks, positioning the company to capture increased demand for its modern logistics facilities.

Cons of Prologis

  • The stock is currently trading at $128.70, which is below its 50-day moving average of $132.18 and its 200-day moving average of $137.75, indicating a recent downward trend and potential weakness in short-term momentum that could deter risk-averse investors.
  • Prologis, Inc. recently completed a $5 billion share offering, which increases the total number of shares outstanding and may lead to earnings dilution, potentially reducing the per-share value for existing investors despite the capital raised for expansion.
  • The company's debt-to-equity ratio stands at 0.61, and with a current ratio of 0.81, the firm carries a moderate level of leverage that could become a burden if interest rates remain elevated or if economic conditions tighten, affecting its financial flexibility.
A.I. GeneratedThese insights were generated using artificial intelligence. They are based on proprietary MarketBeat data, news articles, and custom LLM A.I. algorithms.
Market Capitalization
$123.66 billion
P/E Ratio
28.71
Consensus Rating
Moderate Buy
Consensus Price Target
$154.05 (+18.4% Upside)
Volume
3.67 million shares
Average Volume
4.17 million shares
Today's Range
$128.66
▼
$130.58
50-Day Range
$124.08
▼
$138.59
52-Week Range
$121.40
▼
$153.35
Dividend Yield
3.28%
Equinix stock logo

3. Equinix NASDAQ:EQIX

$1,068.06 +18.06 (+1.72%)
Closing price 11/11/2026 04:00 PM Eastern
Extended Trading
$1,057.08 -10.98 (-1.03%)
As of 08:34 AM Eastern
Extended trading is trading that happens on electronic markets outside of regular trading hours. This is a fair market value extended hours price provided by Massive. Learn more.

Equinix (Nasdaq: EQIX) is the world's digital infrastructure company . Digital leaders harness Equinix's trusted platform to bring together and interconnect foundational infrastructure at software speed. More about Equinix

Pros of Equinix

  • Equinix, Inc. recently demonstrated strong fundamental performance by beating analyst expectations in its most recent quarterly report, posting earnings per share of $4.93 against a consensus estimate of $4.11, which signals robust operational execution and profitability that often attracts institutional investors seeking growth in the digital infrastructure sector.
  • The company has issued optimistic full-year 2026 guidance, projecting earnings per share between $43.71 and $44.11, which significantly exceeds the consensus estimate of $38.23, indicating that management expects continued strong revenue growth and margin expansion throughout the remainder of the fiscal year.
  • Equinix, Inc. maintains a consistent dividend yield of approximately 2.03%, providing a steady income stream for investors, which is particularly attractive in the current market environment where data center REITs are outperforming other real estate categories despite rising interest rates.

Cons of Equinix

  • The stock experienced a sharp decline of 5.2% in a single session, breaking below the psychological $1,000 support level to reach $997.35, which may indicate short-term technical weakness and potential volatility that could deter risk-averse investors from entering the position.
  • Corporate insiders have been consistently selling their shares, with multiple executives including the CEO and Chairman executing sales in early 2026, which can be interpreted as a lack of confidence in the stock's near-term upside or a desire to diversify personal wealth at current price levels.
  • Equinix, Inc. carries a high price-to-earnings ratio of 59.90, which is significantly above the broader market average, meaning the stock is priced for perfection and any future earnings misses or slower-than-expected growth could lead to a significant de-rating of the share price.
A.I. GeneratedThese insights were generated using artificial intelligence. They are based on proprietary MarketBeat data, news articles, and custom LLM A.I. algorithms.
Market Capitalization
$103.61 billion
P/E Ratio
64.15
Consensus Rating
Moderate Buy
Consensus Price Target
$1,234.13 (+15.5% Upside)
Volume
794,693 shares
Average Volume
707,823 shares
Today's Range
$1,060.82
▼
$1,079.13
50-Day Range
$952.62
▼
$1,068.06
52-Week Range
$720.62
▼
$1,128.68
Dividend Yield
1.97%
American Tower stock logo

4. American Tower NYSE:AMT

$190.29 -0.08 (-0.04%)
Closing price 11/11/2026 03:59 PM Eastern
Extended Trading
$188.80 -1.49 (-0.78%)
As of 08:52 AM Eastern
Extended trading is trading that happens on electronic markets outside of regular trading hours. This is a fair market value extended hours price provided by Massive. Learn more.

American Tower, one of the largest global REITs, is a leading independent owner, operator and developer of multitenant communications real estate with a portfolio of over 224,000 communications sites and a highly interconnected footprint of U.S. More about American Tower

Pros of American Tower

  • The company recently authorized a $2 billion share repurchase program, signaling that the board believes the stock is undervalued and providing a potential floor for the share price.
  • American Tower Co. offers a high dividend yield of 3.79%, with a recent quarterly payment of $1.79 per share, making it an attractive option for income-focused investors seeking consistent cash flow.
  • Analysts maintain a Moderate Buy consensus with an average price target of $216.11, which suggests significant upside potential from the current stock price of $190.29.

Cons of American Tower

  • The company has a high debt-to-equity ratio of 3.30, meaning it relies heavily on borrowed funds to finance its operations, which can increase financial risk during periods of economic uncertainty.
  • American Tower Co. has a payout ratio of 100.99%, indicating that it is distributing more in dividends than it earns in net income, which could limit its ability to reinvest in growth or absorb financial shocks.
  • The stock has underperformed the broader market over the past year, with a 52-week low of $160.06 and a current price of $190.29, suggesting that it has not kept pace with overall market gains.
A.I. GeneratedThese insights were generated using artificial intelligence. They are based on proprietary MarketBeat data, news articles, and custom LLM A.I. algorithms.
Market Capitalization
$88.29 billion
P/E Ratio
26.84
Consensus Rating
Moderate Buy
Consensus Price Target
$216.11 (+13.6% Upside)
Volume
1.83 million shares
Average Volume
3.39 million shares
Today's Range
$188.07
▼
$191.32
50-Day Range
$161.09
▼
$195.16
52-Week Range
$160.06
▼
$202.50
Dividend Yield
3.79%
Simon Property Group stock logo

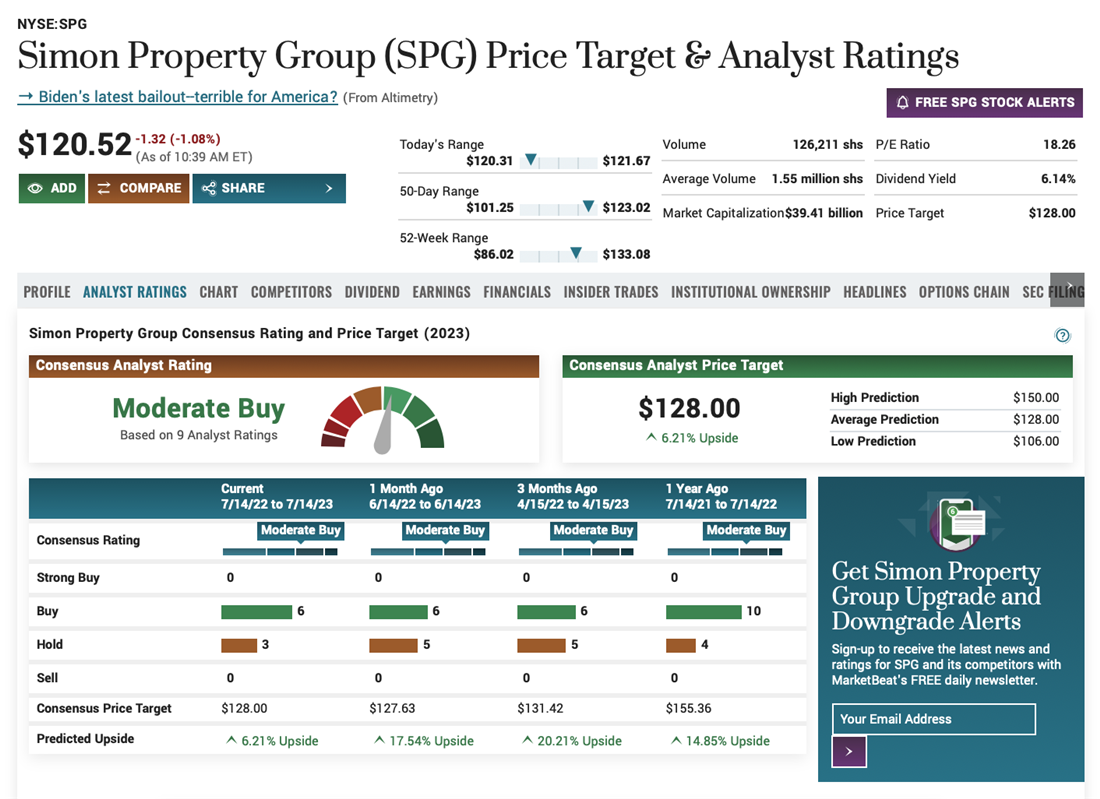
5. Simon Property Group NYSE:SPG

$234.81 +0.33 (+0.14%)
Closing price 11/11/2026 03:59 PM Eastern
Extended Trading
$234.75 -0.06 (-0.02%)
As of 08:52 AM Eastern
Extended trading is trading that happens on electronic markets outside of regular trading hours. This is a fair market value extended hours price provided by Massive. Learn more.

Simon Property Group, Inc (NYSE:SPG) is a self-administered and self-managed real estate investment trust (REIT). Simon Property Group, L.P., or the Operating Partnership, is our majority-owned partnership subsidiary that owns all of our real estate properties and other assets. More about Simon Property Group

Pros of Simon Property Group

  • Simon Property Group, Inc. recently reported third-quarter earnings that significantly exceeded analyst expectations, with earnings per share of $3.37 compared to a consensus estimate of $1.69, demonstrating strong operational performance and profitability that can drive shareholder value.
  • The company has raised its full-year 2026 real estate funds from operations guidance to a range of $13.30 to $13.40 per share, an increase of $0.10 from previous estimates, signaling management confidence in sustained cash flow generation and financial stability for the remainder of the year.
  • Investors can benefit from a 3.94% dividend yield, as the company recently increased its quarterly dividend to $2.30 per share, providing a reliable income stream that is supported by the company's strong free cash flow generation, which grew by more than 7.5% year-to-date.

Cons of Simon Property Group

  • The stock's current price of $234.81 is very close to the average analyst price target of $230.10, suggesting that the stock may be fully valued with limited upside potential, as the consensus rating remains a "Hold" with only 0.08% potential upside from recent price targets.
  • Simon Property Group, Inc. carries a high debt-to-equity ratio of 5.57, which indicates a significant leverage level that could expose the company to financial risks if interest rates remain elevated or if economic conditions deteriorate, potentially impacting its ability to service debt.
  • Short interest in the stock has increased, with shares shorted rising to 10,125,759 in the most recent reporting period, representing a 9.66% month-over-month increase, which suggests that a portion of the market is betting against the stock's future performance and could lead to downward price pressure.
A.I. GeneratedThese insights were generated using artificial intelligence. They are based on proprietary MarketBeat data, news articles, and custom LLM A.I. algorithms.
Market Capitalization
$75.87 billion
P/E Ratio
16.94
Consensus Rating
Hold
Consensus Price Target
$230.10 (-2.0% Downside)
Volume
1.23 million shares
Average Volume
1.43 million shares
Today's Range
$233.09
▼
$235.37
50-Day Range
$197.47
▼
$234.81
52-Week Range
$177.88
▼
$238.50
Dividend Yield
3.84%
Digital Realty Trust stock logo

6. Digital Realty Trust NYSE:DLR

$181.15 +0.27 (+0.15%)
Closing price 11/11/2026 03:59 PM Eastern
Extended Trading
$180.26 -0.90 (-0.50%)
As of 08:40 AM Eastern
Extended trading is trading that happens on electronic markets outside of regular trading hours. This is a fair market value extended hours price provided by Massive. Learn more.

Digital Realty Trust, Inc operates as a real estate investment trust, which engages in the provision of data center, colocation and interconnection solutions. More about Digital Realty Trust

Pros of Digital Realty Trust

  • The company recently demonstrated strong operational momentum by reporting Q3 revenue of $1.90 billion, which significantly exceeded the consensus estimate of $1.75 billion and marked a 20.6% year-over-year increase, indicating robust demand for its data center infrastructure.
  • Digital Realty Trust, Inc. is currently trading at $181.15, which is well below the consensus price target of $221.53 set by thirty-four brokerages, suggesting a potential upside of over 22% for investors who align with the "Moderate Buy" consensus rating.
  • The stock recently crossed above its 50-day moving average, a technical indicator that often signals a shift in short-term momentum and suggests that recent selling pressure may be easing as the price recovers from its 52-week low of $146.23.

Cons of Digital Realty Trust

  • The company's valuation is high, with a P/E ratio of 75.80, which is significantly above the broader market average and suggests that the stock price may be overvalued relative to its current earnings, leaving little room for error if growth slows.
  • Digital Realty Trust, Inc. recently paid a 45% premium to acquire a 9.9% stake in Australian data center company NEXTDC, a move that could strain the company's balance sheet and raise concerns about the return on investment for this aggressive expansion strategy.
  • The company's liquidity position is somewhat weak, with a current ratio of 0.72, meaning its current liabilities exceed its current assets, which could limit its ability to cover short-term obligations without accessing external financing or selling assets.
A.I. GeneratedThese insights were generated using artificial intelligence. They are based on proprietary MarketBeat data, news articles, and custom LLM A.I. algorithms.
Market Capitalization
$68.43 billion
P/E Ratio
75.80
Consensus Rating
Moderate Buy
Consensus Price Target
$221.53 (+22.3% Upside)
Volume
4.05 million shares
Average Volume
2.78 million shares
Today's Range
$179.35
▼
$186.13
50-Day Range
$170.72
▼
$189.56
52-Week Range
$146.23
▼
$208.14
Dividend Yield
2.71%
Public Storage stock logo

7. Public Storage NYSE:PSA

$335.38 -0.55 (-0.16%)
Closing price 11/11/2026 03:59 PM Eastern
Extended Trading
$335.00 -0.38 (-0.11%)
As of 08:47 AM Eastern
Extended trading is trading that happens on electronic markets outside of regular trading hours. This is a fair market value extended hours price provided by Massive. Learn more.

Public Storage, a member of the S&P 500 and FT Global 500, is a REIT that primarily acquires, develops, owns, and operates self-storage facilities. More about Public Storage

Pros of Public Storage

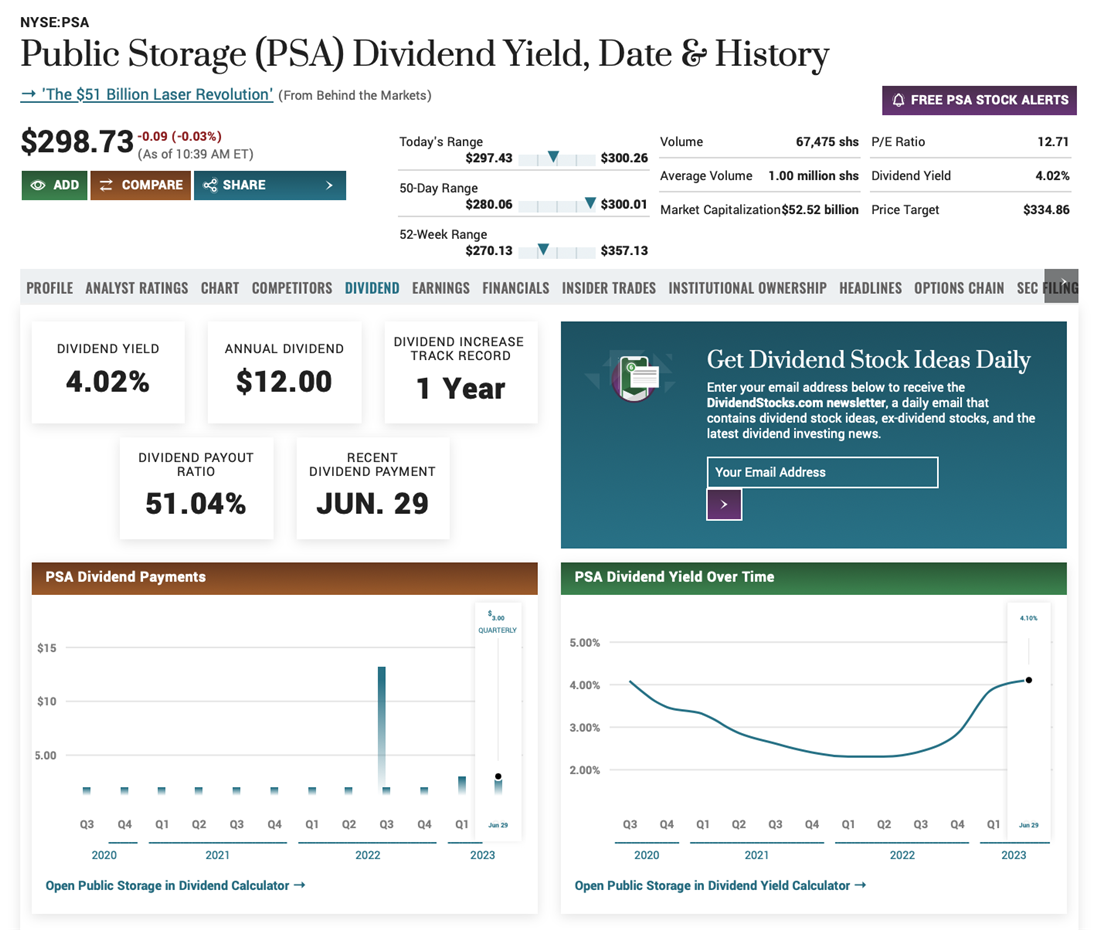
  • Public Storage recently declared a fourth-quarter dividend of $3.00 per share, payable on January 8, 2027, which results in an annualized dividend of $12.00 and a yield of approximately 3.5% based on the current stock price of $340.04, providing a consistent income stream for shareholders.
  • The company demonstrated strong revenue performance in its most recent quarter, reporting $1.37 billion in revenue, which exceeded the analyst consensus estimate of $1.34 billion, indicating that the business is generating more income than expected despite a lower earnings per share figure.
  • Public Storage has shown significant price momentum, reaching a new 52-week high of $345.89, which suggests strong investor confidence and upward trajectory in the stock's value over the past year.

Cons of Public Storage

  • Public Storage missed analyst expectations for earnings per share in its most recent quarter, reporting $1.69 compared to the consensus estimate of $2.49, which indicates a significant shortfall in profitability relative to market forecasts.
  • The stock currently trades at $340.04, which is above the consensus price target of $325.79 from seven investment analysts, suggesting that the stock may be overvalued relative to the average analyst recommendation.
  • Wall Street Zen recently downgraded Public Storage from a "hold" rating to a "sell" rating, indicating a negative outlook on the stock's future performance and potential for decline.
A.I. GeneratedThese insights were generated using artificial intelligence. They are based on proprietary MarketBeat data, news articles, and custom LLM A.I. algorithms.
Market Capitalization
$62.77 billion
P/E Ratio
35.12
Consensus Rating
Hold
Consensus Price Target
$325.79 (-2.9% Downside)
Volume
705,946 shares
Average Volume
1.09 million shares
Today's Range
$332.04
▼
$336.80
50-Day Range
$281.91
▼
$342.56
52-Week Range
$256.54
▼
$345.89
Dividend Yield
3.57%
Realty Income stock logo

8. Realty Income NYSE:O

$59.60 +0.06 (+0.10%)
Closing price 11/11/2026 03:59 PM Eastern
Extended Trading
$59.60 0.00 (-0.01%)
As of 08:52 AM Eastern
Extended trading is trading that happens on electronic markets outside of regular trading hours. This is a fair market value extended hours price provided by Massive. Learn more.

Realty Income, The Monthly Dividend Company, is an S&P 500 company and member of the S&P 500 Dividend Aristocrats index. More about Realty Income

Pros of Realty Income

  • Realty Income Co. recently reported third-quarter 2026 earnings that exceeded expectations, with adjusted funds from operations of $1.12 per share, and management subsequently raised its full-year outlook, signaling confidence in the company's ability to sustain its cash flow generation and dividend payments.
  • The stock currently trades at $59.53, which is below the average analyst price target of $71.51, suggesting potential upside for investors as the consensus rating stands at Moderate Buy with multiple analysts, including Huntington, maintaining Strong Buy ratings following recent earnings updates.
  • As a member of the S&P 500 Dividend Aristocrats index, Realty Income Co. has declared 644 consecutive monthly dividends and increased its payout 123 times since its public listing, offering a reliable income stream with a current yield of 5.50% that appeals to income-focused investors.

Cons of Realty Income

  • Realty Income Co. has a high dividend payout ratio of 224.83%, meaning the company pays out more in dividends than it earns in net income, which may raise concerns about the sustainability of the dividend if cash flow from operations does not continue to grow sufficiently.
  • Some analysts have recently downgraded their outlook, with Cantor Fitzgerald cutting its price target from $68 to $63 and moving to a Neutral rating, and Wells Fargo lowering its target to $59.00, reflecting a more cautious view on the stock's near-term growth potential.
  • The stock has experienced volatility, hitting a 52-week low of $53.15 in October 2026, and while it has since recovered, the decline from its 52-week high of $67.93 indicates that the stock is sensitive to market conditions and interest rate changes.
A.I. GeneratedThese insights were generated using artificial intelligence. They are based on proprietary MarketBeat data, news articles, and custom LLM A.I. algorithms.
Market Capitalization
$56.62 billion
P/E Ratio
41.10
Consensus Rating
Hold
Consensus Price Target
$71.69 (+20.3% Upside)
Volume
4.75 million shares
Average Volume
7.13 million shares
Today's Range
$58.95
▼
$59.63
50-Day Range
$53.35
▼
$61.71
52-Week Range
$53.15
▼
$67.93
Dividend Yield
5.47%
Ventas stock logo

9. Ventas NYSE:VTR

$90.36 +0.03 (+0.03%)
Closing price 11/11/2026 03:59 PM Eastern
Extended Trading
$90.08 -0.29 (-0.32%)
As of 08:07 AM Eastern
Extended trading is trading that happens on electronic markets outside of regular trading hours. This is a fair market value extended hours price provided by Massive. Learn more.

Ventas Inc (NYSE: VTR) is a leading S&P 500 real estate investment trust focused on delivering strong, sustainable shareholder returns by enabling exceptional environments that benefit a large and growing aging population. More about Ventas

Pros of Ventas

  • Ventas, Inc. is trading at a current stock price of $89.43, which is below the average analyst price target of $99.41, suggesting potential upside for investors as the consensus rating remains a Moderate Buy from 21 research firms.
  • The company recently raised its full-year 2026 normalized FFO per share outlook to a range of $3.87 to $3.90, reflecting strong performance in its senior housing operating portfolio and increased investment activity driven by an aging U.S. population.
  • With 2026 acquisition totals reaching $5.2 billion and potentially more purchases ahead, Ventas, Inc. is actively expanding its portfolio of senior housing communities and outpatient medical buildings, positioning itself to capitalize on the growing demand for senior living services.

Cons of Ventas

  • The company reported an EPS of $0.13 for the quarter, missing the consensus estimate of $0.98 by $0.85, which led to a gap down in the stock price following the earnings release on October 27, 2026.
  • Ventas, Inc. has a high dividend payout ratio of 392.45%, indicating that the company is paying out more in dividends than it is earning, which could raise concerns about the sustainability of its dividend payments.
  • The stock has a price-to-earnings ratio of 23.54, which is relatively high compared to some of its peers, potentially making the stock overvalued if earnings growth does not continue to meet expectations.
A.I. GeneratedThese insights were generated using artificial intelligence. They are based on proprietary MarketBeat data, news articles, and custom LLM A.I. algorithms.
Market Capitalization
$47.77 billion
P/E Ratio
170.50
Consensus Rating
Moderate Buy
Consensus Price Target
$99.68 (+10.3% Upside)
Volume
2.40 million shares
Average Volume
3.70 million shares
Today's Range
$89.38
▼
$90.60
50-Day Range
$79.96
▼
$92.14
52-Week Range
$73.82
▼
$101.60
Dividend Yield
2.30%
CBRE Group stock logo

10. CBRE Group NYSE:CBRE

$134.42 -0.37 (-0.28%)
Closing price 11/11/2026 03:59 PM Eastern
Extended Trading
$135.70 +1.28 (+0.95%)
As of 08:29 AM Eastern
Extended trading is trading that happens on electronic markets outside of regular trading hours. This is a fair market value extended hours price provided by Massive. Learn more.

CBRE Group, Inc operates as a commercial real estate services and investment company in the United States, the United Kingdom, and internationally. More about CBRE Group

Pros of CBRE Group

  • CBRE Group, Inc. recently completed a $1 billion senior notes offering to fund the acquisition of Onnec, a move that expands the company's data center infrastructure services and positions it to capitalize on the growing demand for digital infrastructure.
  • The company demonstrated strong earnings resilience by reporting third-quarter EPS of $2.05, which exceeded the consensus estimate of $1.96, while maintaining full-year 2026 core earnings guidance of $7.80 to $7.90 per share.
  • With the current stock price at $136.63, CBRE Group, Inc. trades at a P/E ratio of 17.75, which is below the average price target of $185.44 set by analysts who maintain a consensus rating of Moderate Buy.

Cons of CBRE Group

  • Despite the EPS beat, third-quarter revenue of $11.52 billion missed the consensus estimate of $11.81 billion, leading to a significant stock decline and concerns about underlying softness in commercial real estate leasing.
  • Management has indicated that lower growth in real estate capital-markets-driven businesses is offsetting stronger infrastructure growth, and two facilities-management accounts are being restructured, which could weigh on near-term results.
  • The stock has experienced significant volatility, hitting a 52-week low of $121.44 in late October 2026, and currently trades below its 200-day simple moving average of $141.51, suggesting a potential downtrend.
A.I. GeneratedThese insights were generated using artificial intelligence. They are based on proprietary MarketBeat data, news articles, and custom LLM A.I. algorithms.
Market Capitalization
$38.85 billion
P/E Ratio
28.78
Consensus Rating
Moderate Buy
Consensus Price Target
$182.78 (+36.0% Upside)
Volume
1.72 million shares
Average Volume
2.77 million shares
Today's Range
$133.25
▼
$135.70
50-Day Range
$121.79
▼
$148.53
52-Week Range
$121.44
▼
$174.27
Dividend Yield
N/A
Crown Castle stock logo

11. Crown Castle NYSE:CCI

$89.14 -0.21 (-0.23%)
Closing price 11/11/2026 03:59 PM Eastern
Extended Trading
$89.00 -0.14 (-0.15%)
As of 08:49 AM Eastern
Extended trading is trading that happens on electronic markets outside of regular trading hours. This is a fair market value extended hours price provided by Massive. Learn more.

Crown Castle owns, operates and leases more than 40,000 cell towers and approximately 90,000 route miles of fiber supporting small cells and fiber solutions across every major U.S. More about Crown Castle

Pros of Crown Castle

  • The stock has experienced a significant recent surge, rising 31% from October 2 to November 2, 2026, driven by potential leasing opportunities with SpaceX for wireless spectrum and tower access, which could provide a new revenue stream and support future rental income.
  • Crown Castle Inc. offers a high dividend yield of 4.76% based on the current stock price of $89.14, providing a substantial income stream for investors, with the most recent quarterly dividend of $1.0625 per share declared on November 5, 2026, payable on December 31, 2026.
  • The company's stock is trading at $89.14, which is below the consensus price target of $94.27, suggesting potential upside for investors as the stock has a consensus rating of "Moderate Buy" from analysts who see value in the company's infrastructure portfolio.

Cons of Crown Castle

  • The company's quarterly revenue has declined 7.2% year-over-year, with the most recent quarter showing revenue of $995 million, missing analyst estimates of $1.01 billion, which may indicate challenges in maintaining growth in its core business.
  • Crown Castle Inc. has a high dividend payout ratio of 223.68%, which could raise concerns about the sustainability of its dividend payments, especially if the company faces financial pressures or needs to invest heavily in its infrastructure.
  • The stock's P/E ratio of 19.81 is relatively high compared to some peers, which may limit upside potential if earnings growth does not accelerate, and the company's negative return on equity of 42.11% in the most recent quarter suggests inefficiency in generating profits from shareholders' equity.
A.I. GeneratedThese insights were generated using artificial intelligence. They are based on proprietary MarketBeat data, news articles, and custom LLM A.I. algorithms.
Market Capitalization
$38.02 billion
P/E Ratio
46.92
Consensus Rating
Moderate Buy
Consensus Price Target
$94.27 (+5.8% Upside)
Volume
2.26 million shares
Average Volume
5.76 million shares
Today's Range
$88.16
▼
$89.46
50-Day Range
$66.16
▼
$92.20
52-Week Range
$65.32
▼
$95.07
Dividend Yield
4.76%
Extra Space Storage stock logo

12. Extra Space Storage NYSE:EXR

$159.45 +0.50 (+0.32%)
Closing price 11/11/2026 03:59 PM Eastern
Extended Trading
$158.56 -0.90 (-0.56%)
As of 08:21 AM Eastern
Extended trading is trading that happens on electronic markets outside of regular trading hours. This is a fair market value extended hours price provided by Massive. Learn more.

Extra Space Storage Inc, headquartered in Salt Lake City, Utah, is a self-administered and self-managed REIT and a member of the S&P 500. More about Extra Space Storage

Pros of Extra Space Storage

  • Extra Space Storage Inc. recently raised its full-year Core FFO guidance for the second time in two quarters, signaling strong confidence in its financial trajectory and operational efficiency.
  • The company declared a quarterly dividend of $1.62 per share, which translates to an attractive annualized yield of approximately 4.0% based on the current stock price of $159.87.
  • Major financial institutions have recently upgraded their outlooks, with Jefferies raising its price target to $178 and UBS Group increasing its target to $174, reflecting a consensus view of significant upside potential.

Cons of Extra Space Storage

  • The company reported earnings per share of $1.17 for the most recent quarter, significantly missing the consensus estimate of $2.10 by $0.93, indicating a substantial gap between actual performance and analyst expectations.
  • Extra Space Storage Inc. currently has a dividend payout ratio of 135.8%, meaning it cannot cover its dividend payments with current earnings alone and must rely on its balance sheet to fulfill these obligations.
  • Despite recent upgrades, the average analyst price target remains at $148.667, which is below the current stock price of $159.87, suggesting that the stock may be trading above its fair value according to the broader market consensus.
A.I. GeneratedThese insights were generated using artificial intelligence. They are based on proprietary MarketBeat data, news articles, and custom LLM A.I. algorithms.
Market Capitalization
$33.18 billion
P/E Ratio
18.83
Consensus Rating
Moderate Buy
Consensus Price Target
$156.75 (-1.7% Downside)
Volume
1.19 million shares
Average Volume
1.43 million shares
Today's Range
$157.05
▼
$159.61
50-Day Range
$131.57
▼
$161.32
52-Week Range
$125.71
▼
$163.18
Dividend Yield
4.08%
Iron Mountain stock logo

13. Iron Mountain NYSE:IRM

$112.22 +1.44 (+1.30%)
Closing price 11/11/2026 03:59 PM Eastern
Extended Trading
$111.72 -0.50 (-0.45%)
As of 08:19 AM Eastern
Extended trading is trading that happens on electronic markets outside of regular trading hours. This is a fair market value extended hours price provided by Massive. Learn more.

Iron Mountain Incorporated (NYSE: IRM) is a global leader in information management services. Founded in 1951 and trusted by more than 240,000 customers worldwide, Iron Mountain serves to protect and elevate the power of our customers' work. More about Iron Mountain

Pros of Iron Mountain

  • Iron Mountain Incorporated recently raised its quarterly dividend by approximately 15% to $0.9930 per share, signaling strong confidence in its cash flow generation and providing income investors with a yield of roughly 3.12% based on the current stock price of $112.22.
  • The company demonstrated robust operational growth in its third quarter, reporting revenue of $1.99 billion which represented a 13.5% year-over-year increase, driven significantly by a 34% surge in data center revenue that highlights its successful pivot toward high-demand digital infrastructure.
  • Iron Mountain Incorporated beat analyst expectations for its most recent quarter, delivering earnings per share of $0.64 compared to the consensus estimate of $0.61, indicating that the company is effectively managing costs and executing its strategy to unlock value from stored digital and physical assets.

Cons of Iron Mountain

  • The stock is currently trading at $112.22, which is below its 200-day simple moving average of $115.47, a technical indicator that often signals a potential downtrend or weakening momentum for the stock in the near term.
  • Iron Mountain Incorporated reported a negative return on equity of 85.44% for the most recent quarter, a metric that measures how effectively a company uses shareholder capital to generate profits, suggesting that the company's equity base is not currently generating positive returns for investors.
  • There is significant insider selling activity, with CEO William Meaney selling 38,474 shares in November 2026 and other executives like Greg McIntosh also reducing their positions, which can sometimes indicate that company leadership is taking advantage of higher stock prices to diversify their personal wealth.
A.I. GeneratedThese insights were generated using artificial intelligence. They are based on proprietary MarketBeat data, news articles, and custom LLM A.I. algorithms.
Market Capitalization
$32.99 billion
P/E Ratio
73.35
Consensus Rating
Moderate Buy
Consensus Price Target
$141.33 (+25.9% Upside)
Volume
1.32 million shares
Average Volume
1.60 million shares
Today's Range
$111.79
▼
$114.11
50-Day Range
$105.23
▼
$118.99
52-Week Range
$77.77
▼
$134.68
Dividend Yield
3.12%
VICI Properties stock logo

14. VICI Properties NYSE:VICI

$24.94 -0.06 (-0.22%)
Closing price 11/11/2026 03:59 PM Eastern
Extended Trading
$25.09 +0.16 (+0.62%)
As of 08:50 AM Eastern
Extended trading is trading that happens on electronic markets outside of regular trading hours. This is a fair market value extended hours price provided by Massive. Learn more.

VICI Properties Inc is an S&P 500 experiential real estate investment trust that owns one of the largest portfolios of market-leading gaming, hospitality and entertainment destinations, including Caesars Palace Las Vegas, MGM Grand and the Venetian Resort Las Vegas, three of the most iconic entertainment facilities on the Las Vegas Strip. More about VICI Properties

Pros of VICI Properties

  • The stock currently trades at $25.00, which is significantly below the average analyst price target of $29.46, suggesting potential upside of nearly 18% for investors who align with the consensus "Moderate Buy" rating from sixteen research firms.
  • VICI Properties Inc. offers a high dividend yield of 7.31%, which is attractive for income-focused investors, especially as the company recently increased its quarterly dividend from $0.45 to $0.46 per share, demonstrating a commitment to growing shareholder returns.
  • The company maintains a strong balance sheet with a debt-to-equity ratio of 0.57 and a current ratio of 2.35, indicating sufficient liquidity to cover short-term obligations and a manageable level of leverage relative to its equity base.

Cons of VICI Properties

  • The company recently missed earnings expectations, reporting $0.31 in earnings per share for the quarter compared to the consensus estimate of $0.72, a significant shortfall that may raise concerns about near-term profitability and execution.
  • Analyst sentiment has deteriorated recently, with the consensus rating shifting from "Moderate Buy" to "Hold" in late October, and several firms like Citigroup and Cantor Fitzgerald lowering their price targets, reflecting a more cautious outlook on the stock's valuation.
  • The dividend payout ratio stands at 84.40%, which is quite high and may limit the company's flexibility to reinvest in growth or absorb financial shocks, potentially putting pressure on the sustainability of the dividend if earnings decline further.
A.I. GeneratedThese insights were generated using artificial intelligence. They are based on proprietary MarketBeat data, news articles, and custom LLM A.I. algorithms.
Market Capitalization
$27.52 billion
P/E Ratio
11.44
Consensus Rating
Moderate Buy
Consensus Price Target
$29.46 (+18.1% Upside)
Volume
7.54 million shares
Average Volume
10.25 million shares
Today's Range
$24.70
▼
$25.03
50-Day Range
$22.53
▼
$25.69
52-Week Range
$22.42
▼
$30.83
Dividend Yield
7.36%
KE stock logo

15. KE NYSE:BEKE

$17.95 -0.15 (-0.80%)
Closing price 11/11/2026 03:59 PM Eastern
Extended Trading
$17.75 -0.20 (-1.14%)
As of 08:29 AM Eastern
Extended trading is trading that happens on electronic markets outside of regular trading hours. This is a fair market value extended hours price provided by Massive. Learn more.

KE Holdings Inc, through its subsidiaries, engages in operating an integrated online and offline platform for housing transactions and services in the People's Republic of China. More about KE

Pros of KE

  • KE Holdings Inc. recently beat analyst expectations in its most recent quarterly report, posting earnings per share of $0.42 against a consensus estimate of $0.31, which demonstrates strong operational execution and profitability that can drive shareholder value.
  • Institutional investors are showing renewed confidence in the company, with Pzena Investment Management LLC increasing its stake by 17.1% in the third quarter and Robeco Institutional Asset Management B.V. raising its position by 56.5%, suggesting that professional money managers see significant upside potential in the stock.
  • The stock is currently trading at $18.85, which is well below the average analyst price target of $23.64, indicating that the market may be undervaluing the company relative to its fundamental performance and future growth prospects.

Cons of KE

  • Key insiders have been selling significant portions of their holdings, with CEO Yongdong Peng selling over 16 million shares and Director Yigang Shan selling over 3 million shares in late September, which can signal a lack of confidence in the stock's near-term performance from those closest to the company.
  • Zacks Research recently downgraded KE Holdings Inc. from a "strong-buy" rating to a "hold" rating, indicating that some analysts believe the stock's recent momentum or valuation may not justify further aggressive buying at this time.
  • The company's revenue growth has been inconsistent, with a year-over-year revenue decline of 19.0% reported in the May 2026 earnings period, suggesting that the core business may be facing headwinds or market saturation that could impact future earnings stability.
A.I. GeneratedThese insights were generated using artificial intelligence. They are based on proprietary MarketBeat data, news articles, and custom LLM A.I. algorithms.
Market Capitalization
$20.73 billion
P/E Ratio
29.43
Consensus Rating
Moderate Buy
Consensus Price Target
$23.64 (+31.7% Upside)
Volume
5.52 million shares
Average Volume
5.05 million shares
Today's Range
$17.89
▼
$18.06
50-Day Range
$15.95
▼
$18.86
52-Week Range
$13.81
▼
$19.88
Dividend Yield
1.23%
SBA Communications stock logo

16. SBA Communications NASDAQ:SBAC

$190.03 -1.40 (-0.73%)
Closing price 11/11/2026 04:00 PM Eastern
Extended Trading
$189.00 -1.04 (-0.54%)
As of 07:00 AM Eastern
Extended trading is trading that happens on electronic markets outside of regular trading hours. This is a fair market value extended hours price provided by Massive. Learn more.

SBA Communications Corporation is a leading independent owner and operator of wireless communications infrastructure including towers, buildings, rooftops, distributed antenna systems (DAS) and small cells. More about SBA Communications

Pros of SBA Communications

  • The stock is currently trading at $193.08, which is below the consensus price target of $224.64 set by nine analysts who have issued a Buy rating, suggesting significant potential for price appreciation as the market digests recent positive earnings surprises.
  • SBA Communications Co. recently reported third-quarter earnings per share of $2.19, which exceeded the analyst consensus estimate of $2.09, demonstrating the company's ability to generate strong profitability even in a challenging market environment.
  • The company offers a stable income stream through its quarterly dividend of $1.25 per share, which annualizes to $5.00 and provides a yield of approximately 2.56%, making it an attractive option for investors seeking consistent cash flow.

Cons of SBA Communications

  • Third-quarter revenue of $713.9 million fell short of the estimated $724 million and declined 2.5% year over year, indicating that domestic leasing weakness and customer churn are negatively impacting the company's top-line growth.
  • The company's updated full-year 2026 revenue guidance of $2.8 billion to $2.9 billion is below the consensus estimate of $2.9 billion, suggesting that management expects continued pressure on revenue growth for the remainder of the fiscal year.
  • Analyst sentiment has become increasingly divided, with recent downgrades from firms like JPMorgan Chase & Co. and Citigroup lowering their price targets and assigning neutral or hold ratings, reflecting concerns about constrained near-term growth opportunities.
A.I. GeneratedThese insights were generated using artificial intelligence. They are based on proprietary MarketBeat data, news articles, and custom LLM A.I. algorithms.
Market Capitalization
$20.31 billion
P/E Ratio
20.50
Consensus Rating
Moderate Buy
Consensus Price Target
$224.64 (+18.2% Upside)
Volume
707,243 shares
Average Volume
1.25 million shares
Today's Range
$189.66
▼
$191.93
50-Day Range
$158.02
▼
$195.48
52-Week Range
$156.60
▼
$224.46
Dividend Yield
2.61%
Host Hotels & Resorts stock logo

17. Host Hotels & Resorts NASDAQ:HST

$25.78 -0.15 (-0.58%)
Closing price 11/11/2026 04:00 PM Eastern
Extended Trading
$25.79 +0.01 (+0.04%)
As of 08:43 AM Eastern
Extended trading is trading that happens on electronic markets outside of regular trading hours. This is a fair market value extended hours price provided by Massive. Learn more.

Host Hotels & Resorts, Inc. is a real estate investment trust, which engages in the management of luxury and upper-upscale hotels. It operates through the following geographical segments: United States, Brazil, and Canada. The company was founded in 1927 and is headquartered in Bethesda, MD.

Market Capitalization
$17.77 billion
P/E Ratio
18.82
Consensus Rating
Moderate Buy
Consensus Price Target
$25.55 (-0.9% Downside)
Volume
6.50 million shares
Average Volume
9.80 million shares
Today's Range
$25.69
▼
$26.02
50-Day Range
$21.76
▼
$26.13
52-Week Range
$16.77
▼
$26.19
Dividend Yield
3.16%
Essex Property Trust stock logo

18. Essex Property Trust NYSE:ESS

$274.07 -1.68 (-0.61%)
Closing price 11/11/2026 03:59 PM Eastern
Extended Trading
$278.17 +4.09 (+1.49%)
As of 08:05 AM Eastern
Extended trading is trading that happens on electronic markets outside of regular trading hours. This is a fair market value extended hours price provided by Massive. Learn more.

Essex Property Trust, Inc., an S&P 500 company, is a fully integrated real estate investment trust (REIT) that acquires, develops, redevelops, and manages multifamily residential properties in selected West Coast markets. Essex currently has ownership interests in 252 apartment communities comprising approximately 62,000 apartment homes with an additional property in active development.

Market Capitalization
$17.74 billion
P/E Ratio
50.85
Consensus Rating
Moderate Buy
Consensus Price Target
$297.53 (+8.6% Upside)
Volume
387,854 shares
Average Volume
609,841 shares
Today's Range
$272.23
▼
$275.67
50-Day Range
$261.70
▼
$282.45
52-Week Range
$238.46
▼
$303.35
Dividend Yield
3.76%
Jones Lang LaSalle stock logo

19. Jones Lang LaSalle NYSE:JLL

$371.89 -2.48 (-0.66%)
Closing price 11/11/2026 03:59 PM Eastern
Extended Trading
$372.50 +0.60 (+0.16%)
As of 08:53 AM Eastern
Extended trading is trading that happens on electronic markets outside of regular trading hours. This is a fair market value extended hours price provided by Massive. Learn more.

Jones Lang LaSalle Incorporated operates as a commercial real estate and investment management company. It engages in the buying, building, occupying, managing, and investing in a commercial, industrial, hotel, residential, and retail properties in Americas, Europe, the Middle East, Africa, and the Asia Pacific. The company offers a range of real estate services, including agency leasing, tenant representation, property management, advisory, and consulting services; and capital market services, such as equity and debt advisory, loan sales, equity advisory, loan servicing, merger and acquisition, corporate advisory, and investment sales and advisory services. It also provides on-site management services for office, industrial, retail, multifamily residential, and various other properties; integrated facilities management services; designing, building, management, and consulting services to tenants of leased space, owners in self-occupied buildings, and owners of real estate investments; and advisory, consulting, valuation, and energy and sustainability services. In addition, the company offers investment management services to institutional and retail investors, including high-net-worth individuals. It provides its services to real estate owners, occupiers, investors, and developers for various property types, including critical environments and data centers, offices, industrial and warehouses, residential properties, infrastructure projects, retail and shopping malls, logistics, and military housing and transportation centers; and hotels and hospitality, cultural, educational, government, healthcare and laboratory, and sports facilities. The company was formerly known as LaSalle Partners Incorporated and changed its name to Jones Lang LaSalle Incorporated in March 1999. Jones Lang LaSalle Incorporated was incorporated in 1997 and is headquartered in Chicago, Illinois.

Market Capitalization
$17.10 billion
P/E Ratio
16.09
Consensus Rating
Moderate Buy
Consensus Price Target
$427.60 (+15.0% Upside)
Volume
384,471 shares
Average Volume
572,356 shares
Today's Range
$367.23
▼
$375.42
50-Day Range
$294.97
▼
$389.90
52-Week Range
$259.83
▼
$395.79
Dividend Yield
N/A
Kimco Realty stock logo

20. Kimco Realty NYSE:KIM

$25.60 -0.08 (-0.29%)
Closing price 11/11/2026 03:59 PM Eastern
Extended Trading
$25.62 +0.02 (+0.08%)
As of 08:40 AM Eastern
Extended trading is trading that happens on electronic markets outside of regular trading hours. This is a fair market value extended hours price provided by Massive. Learn more.

Kimco Realty Corp. is a real estate investment trust (REIT) headquartered in New Hyde Park, N.Y., that is one of North America's largest publicly traded owners and operators of open-air shopping centers. As of December 31, 2018, the company owned interests in 437 U.S. shopping centers comprising 76 million square feet of leasable space primarily concentrated in the top major metropolitan markets.

Market Capitalization
$17.02 billion
P/E Ratio
23.93
Consensus Rating
Moderate Buy
Consensus Price Target
$26.12 (+2.0% Upside)
Volume
5.94 million shares
Average Volume
6.90 million shares
Today's Range
$25.41
▼
$25.71
50-Day Range
$21.85
▼
$25.89
52-Week Range
$19.76
▼
$26.65
Dividend Yield
4.34%
Lamar Advertising stock logo

21. Lamar Advertising NASDAQ:LAMR

$162.62 -0.78 (-0.48%)
Closing price 11/11/2026 04:00 PM Eastern
Extended Trading
$161.81 -0.81 (-0.50%)
As of 08:36 AM Eastern
Extended trading is trading that happens on electronic markets outside of regular trading hours. This is a fair market value extended hours price provided by Massive. Learn more.

Lamar Advertising Company operates as an outdoor advertising company in the United States and Canada. The company owns and operates billboards, logo signs, and transit advertising displays, as well as rents space for advertising on billboards, buses, shelters, benches, logo plates, and in airport terminals. Lamar Advertising Company was founded in 1902 and is headquartered in Baton Rouge, Louisiana.

Market Capitalization
$16.59 billion
P/E Ratio
28.68
Consensus Rating
Hold
Consensus Price Target
$159.14 (-2.1% Downside)
Volume
725,142 shares
Average Volume
665,235 shares
Today's Range
$161.01
▼
$164.05
50-Day Range
$143.24
▼
$163.40
52-Week Range
$122.31
▼
$166.33
Dividend Yield
4.04%
Invitation Homes stock logo

22. Invitation Homes NYSE:INVH

$26.87 -0.22 (-0.83%)
Closing price 11/11/2026 03:59 PM Eastern
Extended Trading
$26.77 -0.10 (-0.36%)
As of 08:17 AM Eastern
Extended trading is trading that happens on electronic markets outside of regular trading hours. This is a fair market value extended hours price provided by Massive. Learn more.

Invitation Homes, an S&P 500 company, is the nation's premier single-family home leasing and management company, meeting changing lifestyle demands by providing access to high-quality, updated homes with valued features such as close proximity to jobs and access to good schools. More about Invitation Homes

Pros of Invitation Homes

  • Invitation Homes Inc. recently raised its full-year 2026 Core FFO per share guidance to a range of $1.94 to $1.98, which exceeds the current consensus estimate of $1.90, signaling management confidence in continued earnings growth and operational efficiency.
  • The company expanded its share repurchase authorization by an additional $500 million, a move that supports shareholder value by reducing the share count and potentially boosting earnings per share, particularly as the stock trades at $27.09, which is below the consensus price target of $32.00.
  • Invitation Homes Inc. demonstrated strong financial performance in the third quarter by reporting earnings per share of $0.27, significantly beating the consensus estimate of $0.18, while maintaining a net margin of 23.54% and achieving 6.3% year-over-year revenue growth.

Cons of Invitation Homes

  • The company's dividend payout ratio stands at 105.26%, meaning it is paying out more in dividends than it earns in net income, which could raise concerns about the sustainability of the dividend if earnings do not improve or if the company relies on debt or asset sales to fund distributions.
  • Short interest has been rising steadily, with shares shorted increasing to 19,546,009 as of October 30, 2026, representing a 7.29% month-over-month increase, suggesting that a growing number of traders are betting against the stock's future performance.
  • Invitation Homes Inc. missed revenue expectations in the third quarter, reporting $731.28 million against an estimate of $742.55 million, which may indicate challenges in maintaining top-line growth despite strong earnings per share results.
A.I. GeneratedThese insights were generated using artificial intelligence. They are based on proprietary MarketBeat data, news articles, and custom LLM A.I. algorithms.
Market Capitalization
$15.61 billion
P/E Ratio
23.57
Consensus Rating
Moderate Buy
Consensus Price Target
$31.79 (+18.3% Upside)
Volume
3.52 million shares
Average Volume
5.71 million shares
Today's Range
$26.65
▼
$26.99
50-Day Range
$25.89
▼
$28.84
52-Week Range
$24.25
▼
$30.89
Dividend Yield
4.43%
W.P. Carey stock logo

23. W.P. Carey NYSE:WPC

$64.84 -0.53 (-0.81%)
Closing price 11/11/2026 03:59 PM Eastern
Extended Trading
$65.05 +0.21 (+0.32%)
As of 08:36 AM Eastern
Extended trading is trading that happens on electronic markets outside of regular trading hours. This is a fair market value extended hours price provided by Massive. Learn more.

W. P. Carey ranks among the largest net lease REITs with a well-diversified portfolio of high-quality, operationally critical commercial real estate, which includes 1,424 net lease properties covering approximately 173 million square feet and a portfolio of 89 self-storage operating properties as of December 31, 2023. With offices in New York, London, Amsterdam and Dallas, the company remains focused on investing primarily in single-tenant, industrial, warehouse and retail properties located in the U.S. and Northern and Western Europe, under long-term net leases with built-in rent escalations.

Market Capitalization
$14.92 billion
P/E Ratio
22.36
Consensus Rating
Moderate Buy
Consensus Price Target
$76.79 (+18.4% Upside)
Volume
1.55 million shares
Average Volume
1.79 million shares
Today's Range
$64.27
▼
$65.07
50-Day Range
$62.54
▼
$70.57
52-Week Range
$62.19
▼
$77.22
Dividend Yield
5.77%
Weyerhaeuser stock logo

24. Weyerhaeuser NYSE:WY

$20.64 +0.01 (+0.06%)
Closing price 11/11/2026 03:59 PM Eastern
Extended Trading
$20.65 +0.01 (+0.04%)
As of 08:48 AM Eastern
Extended trading is trading that happens on electronic markets outside of regular trading hours. This is a fair market value extended hours price provided by Massive. Learn more.

Weyerhaeuser Company, one of the world's largest private owners of timberlands, began operations in 1900. We own or control approximately 11 million acres of timberlands in the U.S. More about Weyerhaeuser

Pros of Weyerhaeuser

  • Weyerhaeuser recently reported third-quarter earnings that exceeded analyst expectations, posting $0.08 in earnings per share against a consensus estimate of $0.04, which demonstrates the company's ability to generate profit even in a challenging market environment.
  • The stock currently trades at $20.62, which is significantly below the average analyst price target of $26.10, suggesting that the market may be undervaluing the company relative to its fundamental performance and future growth potential.
  • Weyerhaeuser offers a high dividend yield of 3.98%, providing investors with a substantial income stream that is attractive compared to many other stocks in the real estate and timber sectors.

Cons of Weyerhaeuser

  • Weyerhaeuser's dividend payout ratio is currently 135.48%, meaning the company is paying out more in dividends than it is earning in profits, which could raise concerns about the sustainability of the dividend in the long term.
  • The stock has experienced a significant decline from its 52-week high of $27.75 to its current price of $20.62, reflecting a downward trend that may indicate ongoing market skepticism about the company's future performance.
  • Short interest in Weyerhaeuser has increased, with the number of shares shorted rising to 34.6 million in the most recent reporting period, suggesting that a growing number of investors are betting against the stock's price appreciation.
A.I. GeneratedThese insights were generated using artificial intelligence. They are based on proprietary MarketBeat data, news articles, and custom LLM A.I. algorithms.
Market Capitalization
$14.86 billion
P/E Ratio
33.29
Consensus Rating
Moderate Buy
Consensus Price Target
$26.10 (+26.4% Upside)
Volume
4.69 million shares
Average Volume
8.23 million shares
Today's Range
$20.25
▼
$20.66
50-Day Range
$18.46
▼
$23.20
52-Week Range
$18.25
▼
$27.75
Dividend Yield
3.98%
Omega Healthcare Investors stock logo

25. Omega Healthcare Investors NYSE:OHI

$48.13 -0.57 (-1.17%)
Closing price 11/11/2026 03:59 PM Eastern
Extended Trading
$47.90 -0.23 (-0.47%)
As of 08:46 AM Eastern
Extended trading is trading that happens on electronic markets outside of regular trading hours. This is a fair market value extended hours price provided by Massive. Learn more.

Omega Healthcare Investors, Inc. engages in the provision of financing and capital to the long-term healthcare industry with a particular focus on skilled nursing facilities, assisted living facilities, independent living facilities, rehabilitation and acute care facilities, and medical office buildings. The company was founded on March 31, 1992 and is headquartered in Hunt Valley, MD.

Market Capitalization
$14.64 billion
P/E Ratio
19.41
Consensus Rating
Hold
Consensus Price Target
$50.27 (+4.4% Upside)
Volume
1.53 million shares
Average Volume
2.09 million shares
Today's Range
$47.73
▼
$48.49
50-Day Range
$43.79
▼
$49.18
52-Week Range
$42.18
▼
$52.39
Dividend Yield
5.57%
Sun Communities stock logo

26. Sun Communities NYSE:SUI

$118.12 -1.13 (-0.95%)
Closing price 11/11/2026 03:59 PM Eastern
Extended Trading
$118.93 +0.81 (+0.69%)
As of 07:32 AM Eastern
Extended trading is trading that happens on electronic markets outside of regular trading hours. This is a fair market value extended hours price provided by Massive. Learn more.

Established in 1975, Sun Communities, Inc. became a publicly owned corporation in December 1993. The Company is a fully integrated REIT listed on the New York Stock Exchange under the symbol: SUI. As of December 31, 2023, the Company owned, operated, or had an interest in a portfolio of 667 developed MH, RV and Marina properties comprising 179,310 developed sites and approximately 48,030 wet slips and dry storage spaces in the U.S., the UK and Canada.

Market Capitalization
$14.23 billion
P/E Ratio
N/A
Consensus Rating
Moderate Buy
Consensus Price Target
$135.65 (+14.8% Upside)
Volume
1.03 million shares
Average Volume
1.33 million shares
Today's Range
$116.55
▼
$118.36
50-Day Range
$110.07
▼
$122.18
52-Week Range
$109.77
▼
$137.85
Dividend Yield
3.76%
Healthpeak Properties stock logo

27. Healthpeak Properties NYSE:DOC

$20.39 -0.02 (-0.08%)
Closing price 11/11/2026 03:59 PM Eastern
Extended Trading
$20.40 +0.01 (+0.02%)
As of 08:36 AM Eastern
Extended trading is trading that happens on electronic markets outside of regular trading hours. This is a fair market value extended hours price provided by Massive. Learn more.

Healthpeak Properties, Inc. is a fully integrated real estate investment trust (REIT) and S&P 500 company. Healthpeak owns, operates, and develops high-quality real estate for healthcare discovery and delivery.

Market Capitalization
$14.07 billion
P/E Ratio
37.77
Consensus Rating
Hold
Consensus Price Target
$21.60 (+5.9% Upside)
Volume
3.64 million shares
Average Volume
6.27 million shares
Today's Range
$20.20
▼
$20.46
50-Day Range
$18.41
▼
$21.06
52-Week Range
$15.70
▼
$22.95
Dividend Yield
5.98%
Regency Centers stock logo

28. Regency Centers NASDAQ:REG

$76.18 -0.36 (-0.47%)
Closing price 11/11/2026 04:00 PM Eastern
Extended Trading
$75.44 -0.75 (-0.98%)
As of 08:33 AM Eastern
Extended trading is trading that happens on electronic markets outside of regular trading hours. This is a fair market value extended hours price provided by Massive. Learn more.

Regency Centers is a preeminent national owner, operator, and developer of shopping centers located in suburban trade areas with compelling demographics. Our portfolio includes thriving properties merchandised with highly productive grocers, restaurants, service providers, and best-in-class retailers that connect to their neighborhoods, communities, and customers. Operating as a fully integrated real estate company, Regency Centers is a qualified real estate investment trust (REIT) that is self-administered, self-managed, and an S&P 500 Index member.

Market Capitalization
$14.02 billion
P/E Ratio
27.30
Consensus Rating
Moderate Buy
Consensus Price Target
$83.26 (+9.3% Upside)
Volume
1.65 million shares
Average Volume
1.35 million shares
Today's Range
$75.35
▼
$76.44
50-Day Range
$70.80
▼
$76.84
52-Week Range
$66.86
▼
$83.66
Dividend Yield
3.97%
Mid-America Apartment Communities stock logo

29. Mid-America Apartment Communities NYSE:MAA

$118.12 -0.74 (-0.63%)
Closing price 11/11/2026 03:59 PM Eastern
Extended Trading
$117.98 -0.14 (-0.12%)
As of 08:05 AM Eastern
Extended trading is trading that happens on electronic markets outside of regular trading hours. This is a fair market value extended hours price provided by Massive. Learn more.

Mid-America Apartment Communities, Inc. is a real estate investment trust, which engages in the operation, acquisition, and development of apartment communities. It operates through the Same Store and Non-Same Store segments. The Same Store Communities segment represents those apartment communities that have been owned and stabilized for at least 12 months as of the first day of the calendar year. The Non-Same Store segment includes recent acquisitions, communities in development or lease-up. The company was founded in 1994 and is headquartered in Germantown, TN.

Market Capitalization
$13.79 billion
P/E Ratio
35.79
Consensus Rating
Hold
Consensus Price Target
$136.82 (+15.8% Upside)
Volume
952,370 shares
Average Volume
1.03 million shares
Today's Range
$117.03
▼
$118.42
50-Day Range
$114.28
▼
$128.65
52-Week Range
$113.95
▼
$144.41
Dividend Yield
5.15%
American Healthcare REIT stock logo

30. American Healthcare REIT NYSE:AHR

$59.22 -0.17 (-0.29%)
Closing price 11/11/2026 03:59 PM Eastern
Extended Trading
$59.25 +0.03 (+0.06%)
As of 08:40 AM Eastern
Extended trading is trading that happens on electronic markets outside of regular trading hours. This is a fair market value extended hours price provided by Massive. Learn more.

Formed by the successful merger of Griffin-American Healthcare REIT III and Griffin-American Healthcare REIT IV, as well as the acquisition of the business and operations of American Healthcare Investors, American Healthcare REIT is one of the larger healthcare-focused real estate investment trusts globally with assets totaling approximately $4.2 billion in gross investment value. The company benefits from a fully integrated management platform comprised of more than one hundred experienced and skilled professionals, many of whom have worked together since 2006 and have successfully invested in and managed healthcare real estate through multiple market cycles. The management team has a proven track record, deep industry relationships and unparalleled insight into each of the company's assets having built and nurtured the company's international portfolio since its original property acquisition in 2014. The strength of the management team, coupled with the quality of the assets, has American Healthcare REIT poised to capitalize on compelling growth driven by powerful demographic trends. With its 19 million-square-foot, 312-building portfolio of medical office buildings, senior housing communities, skilled nursing facilities and integrated senior health campuses diversified across 36 states and the United Kingdom, the tri-party transaction was a critical step in ideally positioning American Healthcare REIT for a future public listing or IPO on a national stock exchange at the most opportune time. By listing the company's shares on a national exchange, we believe the company will gain greater access to attractive capital that will fuel future growth, broaden our investor base and also provide liquidity to our fellow stockholders. American Healthcare REIT, Inc. operates as a subsidiary of Griffin Capital Company, LLC.

Market Capitalization
$12.95 billion
P/E Ratio
120.86
Consensus Rating
Buy
Consensus Price Target
$64.00 (+8.1% Upside)
Volume
2.86 million shares
Average Volume
3.31 million shares
Today's Range
$59.03
▼
$59.55
50-Day Range
$49.35
▼
$59.36
52-Week Range
$44.81
▼
$59.55
Dividend Yield
1.68%
Equity Lifestyle Properties stock logo

31. Equity Lifestyle Properties NYSE:ELS

$61.98 -0.71 (-1.12%)
Closing price 11/11/2026 03:59 PM Eastern
Extended Trading
$61.94 -0.03 (-0.05%)
As of 08:05 AM Eastern
Extended trading is trading that happens on electronic markets outside of regular trading hours. This is a fair market value extended hours price provided by Massive. Learn more.

Equity LifeStyle Properties, Inc. is a real estate investment trust, which engages in the ownership and operation of lifestyle-oriented properties consisting primarily of manufactured home, and recreational vehicle communities. It operates through the following segments: Property Operations and Home Sales and Rentals Operations. The Property Operations segment owns and operates land lease properties. The Home Sales and Rentals Operations segment purchases, sells, and leases homes. The company was founded by James M. Hankins in December 1992 and is headquartered in Chicago, IL.

Market Capitalization
$12.21 billion
P/E Ratio
30.53
Consensus Rating
Hold
Consensus Price Target
$67.02 (+8.1% Upside)
Volume
1.15 million shares
Average Volume
2.32 million shares
Today's Range
$61.49
▼
$62.32
50-Day Range
$57.70
▼
$63.14
52-Week Range
$57.46
▼
$69.00
Dividend Yield
3.46%
CoStar Group stock logo

32. CoStar Group NASDAQ:CSGP

$30.26 -0.07 (-0.23%)
Closing price 11/11/2026 04:00 PM Eastern
Extended Trading
$30.38 +0.11 (+0.38%)
As of 08:23 AM Eastern
Extended trading is trading that happens on electronic markets outside of regular trading hours. This is a fair market value extended hours price provided by Massive. Learn more.

CoStar Group, Inc provides information, analytics, and online marketplace services to the commercial real estate, hospitality, residential, and related professionals industries in the United States, Canada, Europe, the Asia Pacific, and Latin America. More about CoStar Group

Pros of CoStar Group

  • CoStar Group, Inc. recently reported third-quarter earnings that exceeded expectations, with revenue of $952 million, a 14.1% increase year-over-year, and earnings per share of $0.38, which beat the consensus estimate of $0.34, demonstrating strong fundamental performance and operational efficiency.
  • The company has raised its full-year 2026 adjusted EBITDA guidance, signaling management confidence in continued margin expansion and expense control, which is a positive indicator for future profitability and cash flow generation.
  • CoStar Group, Inc. is currently trading at $30.33, which is significantly below its 52-week high of $70.57 and near its 52-week low of $25.89, potentially presenting a value opportunity for investors looking to buy the stock at a discounted price relative to its historical range.

Cons of CoStar Group

  • Wall Street analysts have recently downgraded their outlook on the stock, with the consensus rating shifting to "Hold" and the consensus price target dropping to $40.11, reflecting a more cautious stance on the company's near-term growth potential compared to earlier in the year.
  • Several major institutional investors, including Sumitomo Mitsui Trust Group Inc. and Asset Management One Co. Ltd., have significantly reduced their holdings in CoStar Group, Inc. during the third quarter, with Sumitomo Mitsui Trust Group decreasing its stake by 91.4%, which may indicate a lack of institutional conviction in the stock's current valuation.
  • The stock has experienced a significant decline from its 52-week high of $70.57 to its current price of $30.33, and it recently crossed below its 50-day moving average, suggesting that the stock is in a downtrend and may face continued downward pressure in the near term.
A.I. GeneratedThese insights were generated using artificial intelligence. They are based on proprietary MarketBeat data, news articles, and custom LLM A.I. algorithms.
Market Capitalization
$12.20 billion
P/E Ratio
68.77
Consensus Rating
Hold
Consensus Price Target
$39.11 (+29.2% Upside)
Volume
3.82 million shares
Average Volume
6.55 million shares
Today's Range
$29.68
▼
$30.38
50-Day Range
$26.95
▼
$35.45
52-Week Range
$25.89
▼
$70.57
Dividend Yield
N/A
American Homes 4 Rent stock logo

33. American Homes 4 Rent NYSE:AMH

$32.51 -0.27 (-0.83%)
Closing price 11/11/2026 03:59 PM Eastern
Extended Trading
$33.01 +0.50 (+1.53%)
As of 08:34 AM Eastern
Extended trading is trading that happens on electronic markets outside of regular trading hours. This is a fair market value extended hours price provided by Massive. Learn more.

American Homes 4 Rent operates as a real estate investment trust. It engages in the acquisition, renovation, leasing, and operating of single-family homes as rental properties. The company was founded by Bradley Wayne Hughes, Sr. on October 19, 2012 and is headquartered in Las Vegas, NV.

Market Capitalization
$11.82 billion
P/E Ratio
26.65
Consensus Rating
Moderate Buy
Consensus Price Target
$36.65 (+12.7% Upside)
Volume
1.71 million shares
Average Volume
2.63 million shares
Today's Range
$32.13
▼
$32.56
50-Day Range
$30.02
▼
$33.11
52-Week Range
$27.22
▼
$35.07
Dividend Yield
4.03%
United Dominion Realty Trust stock logo

34. United Dominion Realty Trust NYSE:UDR

$36.52 -0.14 (-0.38%)
Closing price 11/11/2026 03:59 PM Eastern
Extended Trading
$36.86 +0.34 (+0.94%)
As of 08:27 AM Eastern
Extended trading is trading that happens on electronic markets outside of regular trading hours. This is a fair market value extended hours price provided by Massive. Learn more.

UDR, Inc. (NYSE: UDR), an S&P 500 company, is a leading multifamily real estate investment trust with a demonstrated performance history of delivering superior and dependable returns by successfully managing, buying, selling, developing and redeveloping attractive real estate communities in targeted U.S. markets. As of December 31, 2023, UDR owned or had an ownership position in 60,336 apartment homes including 359 homes under development. For over 51 years, UDR has delivered long-term value to shareholders, the best standard of service to Residents and the highest quality experience for Associates.

Market Capitalization
$11.62 billion
P/E Ratio
17.23
Consensus Rating
Hold
Consensus Price Target
$40.17 (+10.0% Upside)
Volume
4.54 million shares
Average Volume
5.03 million shares
Today's Range
$36.09
▼
$36.56
50-Day Range
$33.30
▼
$37.20
52-Week Range
$33.10
▼
$42.00
Dividend Yield
4.74%
Gaming and Leisure Properties stock logo

35. Gaming and Leisure Properties NASDAQ:GLPI

$39.27 +0.03 (+0.08%)
Closing price 11/11/2026 04:00 PM Eastern
Extended Trading
$39.22 -0.05 (-0.14%)
As of 08:44 AM Eastern
Extended trading is trading that happens on electronic markets outside of regular trading hours. This is a fair market value extended hours price provided by Massive. Learn more.

Gaming & Leisure Properties, Inc. engages in the provision of acquiring, financing, and owning real estate property to be leased to gaming operators in triple-net lease arrangements. The company was founded on February 13, 2013 and is headquartered in Wyomissing, PA.

Market Capitalization
$11.42 billion
P/E Ratio
12.01
Consensus Rating
Moderate Buy
Consensus Price Target
$47.36 (+20.6% Upside)
Volume
2.37 million shares
Average Volume
2.50 million shares
Today's Range
$38.78
▼
$39.33
50-Day Range
$37.59
▼
$42.36
52-Week Range
$37.33
▼
$49.95
Dividend Yield
8.36%
EastGroup Properties stock logo

36. EastGroup Properties NYSE:EGP

$198.14 -0.44 (-0.22%)
Closing price 11/11/2026 03:59 PM Eastern
Extended Trading
$196.80 -1.33 (-0.67%)
As of 08:19 AM Eastern
Extended trading is trading that happens on electronic markets outside of regular trading hours. This is a fair market value extended hours price provided by Massive. Learn more.

EastGroup Properties, Inc. (NYSE: EGP), a member of the S&P Mid-Cap 400 and Russell 1000 Indexes, is a self-administered equity real estate investment trust focused on the development, acquisition and operation of industrial properties in major Sunbelt markets throughout the United States with an emphasis in the states of Florida, Texas, Arizona, California and North Carolina. The Company's goal is to maximize shareholder value by being a leading provider in its markets of functional, flexible and quality business distribution space for location sensitive customers (primarily in the 20,000 to 100,000 square foot range). The Company's strategy for growth is based on ownership of premier distribution facilities generally clustered near major transportation features in supply-constrained submarkets. The Company's portfolio, including development projects and value-add acquisitions in lease-up and under construction, currently includes approximately 59 million square feet.

Market Capitalization
$10.68 billion
P/E Ratio
33.58
Consensus Rating
Moderate Buy
Consensus Price Target
$219.94 (+11.0% Upside)
Volume
314,551 shares
Average Volume
649,974 shares
Today's Range
$196.92
▼
$198.61
50-Day Range
$190.70
▼
$203.19
52-Week Range
$174.88
▼
$226.71
Dividend Yield
3.51%
BXP stock logo

37. BXP NYSE:BXP

$63.43 -0.11 (-0.17%)
Closing price 11/11/2026 03:59 PM Eastern
Extended Trading
$65.26 +1.83 (+2.89%)
As of 08:41 AM Eastern
Extended trading is trading that happens on electronic markets outside of regular trading hours. This is a fair market value extended hours price provided by Massive. Learn more.

Boston Properties, Inc. (NYSE: BXP) (BXP or the Company) is the largest publicly traded developer, owner, and manager of premier workplaces in the United States, concentrated in six dynamic gateway markets - Boston, Los Angeles, New York, San Francisco, Seattle, and Washington, DC. BXP has delivered places that power progress for our clients and communities for more than 50 years. BXP is a fully integrated real estate company, organized as a real estate investment trust (REIT). Including properties owned by joint ventures, BXP's portfolio totals 53.3 million square feet and 188 properties, including 10 properties under construction/redevelopment. BXP's properties include 167 office properties, 14 retail properties (including two retail properties under construction/redevelopment), six residential properties (including one residential property under construction) and one hotel. BXP is well-known for its inhouse building management expertise and responsiveness to clients' needs. BXP holds a superior track record of developing premium Central Business District (CBD) office buildings, successful mixed-use complexes, suburban office centers and build-to-suit projects for a diverse array of creditworthy clients. BXP actively works to promote its growth and operations in a sustainable and responsible manner. BXP has earned a twelfth consecutive GRESB Green Star recognition and the highest GRESB 5-star Rating. BXP, an S&P 500 company, was founded in 1970 by Mortimer B. Zuckerman and Edward H. Linde and became a public company in 1997.

Market Capitalization
$10.15 billion
P/E Ratio
18.99
Consensus Rating
Moderate Buy
Consensus Price Target
$72.56 (+14.4% Upside)
Volume
1.23 million shares
Average Volume
1.57 million shares
Today's Range
$62.51
▼
$63.86
50-Day Range
$57.65
▼
$68.19
52-Week Range
$49.72
▼
$74.94
Dividend Yield
4.41%
CubeSmart stock logo

38. CubeSmart NYSE:CUBE

$45.08 +0.06 (+0.13%)
Closing price 11/11/2026 03:59 PM Eastern
Extended Trading
$45.62 +0.55 (+1.21%)
As of 08:05 AM Eastern
Extended trading is trading that happens on electronic markets outside of regular trading hours. This is a fair market value extended hours price provided by Massive. Learn more.

CubeSmart is a self-administered and self-managed real estate investment trust. The Company's self-storage properties are designed to offer affordable, easily accessible and, in most locations, climate-controlled storage space for residential and commercial customers. According to the 2023 Self-Storage Almanac, CubeSmart is one of the top three owners and operators of self-storage properties in the United States.

Market Capitalization
$10.06 billion
P/E Ratio
29.85
Consensus Rating
Hold
Consensus Price Target
$43.27 (-4.0% Downside)
Volume
1.29 million shares
Average Volume
2.23 million shares
Today's Range
$44.55
▼
$45.14
50-Day Range
$37.23
▼
$45.84
52-Week Range
$35.09
▼
$46.41
Dividend Yield
4.71%
CareTrust REIT stock logo

39. CareTrust REIT NYSE:CTRE

$38.62 -0.22 (-0.56%)
Closing price 11/11/2026 03:59 PM Eastern
Extended Trading
$37.48 -1.15 (-2.97%)
As of 08:53 AM Eastern
Extended trading is trading that happens on electronic markets outside of regular trading hours. This is a fair market value extended hours price provided by Massive. Learn more.

CareTrust REIT, Inc. is a self-administered, publicly-traded real estate investment trust engaged in the ownership, acquisition, development and leasing of skilled nursing, seniors housing and other healthcare-related properties. With a nationwide portfolio of long-term net-leased properties, and a growing portfolio of quality operators leasing them, CareTrust REIT is pursuing both external and organic growth opportunities across the United States.

Market Capitalization
$10.01 billion
P/E Ratio
24.29
Consensus Rating
Moderate Buy
Consensus Price Target
$43.71 (+13.2% Upside)
Volume
1.75 million shares
Average Volume
2.60 million shares
Today's Range
$38.26
▼
$38.75
50-Day Range
$35.41
▼
$39.67
52-Week Range
$34.74
▼
$43.62
Dividend Yield
4.01%
Janus Living stock logo

40. Janus Living NYSE:JAN

$32.51 -0.37 (-1.12%)
Closing price 11/11/2026 03:59 PM Eastern
Extended Trading
$32.54 +0.03 (+0.09%)
As of 11/11/2026 07:45 PM Eastern
Extended trading is trading that happens on electronic markets outside of regular trading hours. This is a fair market value extended hours price provided by Massive. Learn more.

Upon completion of this offering, we will be the only U.S. publicly traded REIT focused exclusively on the senior housing sector and the only U.S. publicly traded REIT whose entire portfolio is owned and operated under RIDEA structures. We have an initial portfolio consisting of 34 senior housing communities, comprised of 10,422 units as of December 31, 2025. Our communities are located primarily in major retirement markets across 10 states, with units in Florida and Texas representing 69% of the total units as of December 31, 2025. All of our communities are owned and operated under RIDEA structures. Services provided by our operators under a RIDEA structure are primarily paid for directly by the residents, rather than governmental reimbursement programs, which provides us with greater visibility into operating cash flow from our communities. We will be externally managed by Healthpeak Investment Management, LLC, an indirect subsidiary of Healthpeak, which will be our largest stockholder following the completion of this offering and the formation transactions. Healthpeak is an S&P 500 REIT that invests in and manages real estate focused on healthcare discovery and delivery in the United States. Although our Manager was recently formed, Healthpeak has been a public company and an active investor in healthcare real estate for over 40 years. Healthpeak has an extensive network for sourcing and managing senior housing investments that it has established over its long operating history, and we will benefit from this network through our Manager. Our initial portfolio reflects our commitment to delivering sustainable growth through differentiated senior housing solutions and strategic collaborations with high quality operators. We intend to focus exclusively on the senior housing sector because we believe that favorable demographic trends will enable us to create long-term value for our stockholders. We intend to grow our initial portfolio by drawing on our Manager’s origination and sourcing capabilities and established relationships to execute on attractive investment opportunities in the senior housing sector. Of the 34 senior housing communities in our initial portfolio, we describe 15 of these communities, comprising an aggregate of 7,067 units as of December 31, 2025, as “life plan communities.” Life plan communities are a form of senior housing that offer a full continuum of care, including independent living, assisted living, memory care, and skilled nursing, in large-scale communities. Life plan communities differ from other housing and care options for seniors because they typically operate under an entrance fee model, which requires a one-time entrance fee in addition to monthly resident fees, and offer integrated housing, activities, services, and healthcare benefits on a single campus. Life plan communities are designed for individuals and couples seeking an active lifestyle where they can avoid moving a second or third time as they age, and most entrance fee contracts include some level of discounted rates on future healthcare. Compared to traditional rental senior housing, life plan communities offer resident-driven decision making, lifestyle choice, peace of mind from continuum of care, and larger units, with most of our independent living units averaging approximately 1,100 square feet. Residents typically enter our life plan communities in good health in their late 70s or early 80s and stay for eight to ten years — substantially longer than in traditional rental senior housing — supporting stable occupancy and predictable cash flows. The large size of our life plan community campuses, spanning 48 acres of land on average and consisting of approximately 471 units on average as of December 31, 2025, allows us to offer more substantial indoor and outdoor amenities to provide a highly active social life for seniors and create a differentiated senior housing product with high barriers to entry. Due to sizeable land needs, high development costs, financing challenges and pre-leasing requirements, new supply of life plan communities is very low, thereby enabling favorable supply and demand fundamentals for incumbents. We believe life plan communities exhibit consistently resilient occupancy, positioning them as a business with embedded operating leverage and growth visibility, which in turn can provide strong risk-adjusted returns. The other 19 senior housing communities in our initial portfolio, comprising an aggregate of 3,355 units as of December 31, 2025, are primarily independent living, with certain communities offering assisted living, memory care, and/or skilled nursing. These communities are often amenitized, apartment-like buildings with private residences ranging from studios to large apartments. We were formed in December 2025. Our principal executive office is located in Denver, CO.

Market Capitalization
$9.60 billion
P/E Ratio
N/A
Consensus Rating
Moderate Buy
Consensus Price Target
$32.29 (-0.7% Downside)
Volume
2.63 million shares
Average Volume
3.52 million shares
Today's Range
$32.15
▼
$32.91
50-Day Range
$27.32
▼
$32.92
52-Week Range
$22.76
▼
$32.99
Dividend Yield
1.73%
Ryman Hospitality Properties stock logo

41. Ryman Hospitality Properties NYSE:RHP

$138.61 +0.08 (+0.05%)
Closing price 11/11/2026 03:59 PM Eastern
Extended Trading
$138.91 +0.30 (+0.22%)
As of 08:40 AM Eastern
Extended trading is trading that happens on electronic markets outside of regular trading hours. This is a fair market value extended hours price provided by Massive. Learn more.

Ryman Hospitality Properties, Inc. (NYSE: RHP) is a leading lodging and hospitality real estate investment trust that specializes in upscale convention center resorts and entertainment experiences. The Company's holdings include Gaylord Opryland Resort & Convention Center; Gaylord Palms Resort & Convention Center; Gaylord Texan Resort & Convention Center; Gaylord National Resort & Convention Center; and Gaylord Rockies Resort & Convention Center, five of the top seven largest non-gaming convention center hotels in the United States based on total indoor meeting space. The Company also owns the JW Marriott San Antonio Hill Country Resort & Spa as well as two ancillary hotels adjacent to our Gaylord Hotels properties. The Company's hotel portfolio is managed by Marriott International and includes a combined total of 11,414 rooms as well as more than 3 million square feet of total indoor and outdoor meeting space in top convention and leisure destinations across the country. RHP also owns a 70% controlling ownership interest in Opry Entertainment Group (OEG), which is composed of entities owning a growing collection of iconic and emerging country music brands, including the Grand Ole Opry, Ryman Auditorium, WSM 650 AM, Ole Red, Nashville-area attractions, and Block 21, a mixed-use entertainment, lodging, office and retail complex, including the W Austin Hotel and the ACL Live at the Moody Theater, located in downtown Austin, Texas. RHP operates OEG as its Entertainment segment in a taxable REIT subsidiary, and its results are consolidated in the Company's financial results.

Market Capitalization
$9.56 billion
P/E Ratio
33.48
Consensus Rating
Moderate Buy
Consensus Price Target
$136.67 (-1.4% Downside)
Volume
354,647 shares
Average Volume
610,376 shares
Today's Range
$137.62
▼
$139.28
50-Day Range
$119.13
▼
$138.72
52-Week Range
$89.60
▼
$139.28
Dividend Yield
3.46%
Brixmor Property Group stock logo

42. Brixmor Property Group NYSE:BRX

$30.25 -0.08 (-0.25%)
Closing price 11/11/2026 03:59 PM Eastern
Extended Trading
$30.62 +0.37 (+1.21%)
As of 08:39 AM Eastern
Extended trading is trading that happens on electronic markets outside of regular trading hours. This is a fair market value extended hours price provided by Massive. Learn more.

Brixmor Property Group, Inc. operates as a real estate investment trust, which engages in owning and operating a portfolio of grocery anchored community and neighborhood shopping centers. The company was founded in 1985 and is headquartered in New York, NY.

Market Capitalization
$9.31 billion
P/E Ratio
22.08
Consensus Rating
Moderate Buy
Consensus Price Target
$33.14 (+9.5% Upside)
Volume
1.85 million shares
Average Volume
3.24 million shares
Today's Range
$29.99
▼
$30.33
50-Day Range
$26.83
▼
$30.34
52-Week Range
$24.66
▼
$32.86
Dividend Yield
4.06%
Agree Realty stock logo

43. Agree Realty NYSE:ADC

$69.70 -0.18 (-0.26%)
Closing price 11/11/2026 03:59 PM Eastern
Extended Trading
$69.65 -0.04 (-0.06%)
As of 08:34 AM Eastern
Extended trading is trading that happens on electronic markets outside of regular trading hours. This is a fair market value extended hours price provided by Massive. Learn more.

Agree Realty Corporation is a publicly traded real estate investment trust that is RETHINKING RETAIL through the acquisition and development of properties net leased to industry-leading, omni-channel retail tenants. As of December 31, 2023, the Company owned and operated a portfolio of 2,135 properties, located in 49 states and containing approximately 44.2 million square feet of gross leasable area. The Company's common stock is listed on the New York Stock Exchange under the symbol "ADC".

Market Capitalization
$9.09 billion
P/E Ratio
15.39
Consensus Rating
Moderate Buy
Consensus Price Target
$79.85 (+14.6% Upside)
Volume
1.49 million shares
Average Volume
1.74 million shares
Today's Range
$68.72
▼
$69.81
50-Day Range
$64.41
▼
$72.87
52-Week Range
$64.34
▼
$82.08
Dividend Yield
4.65%
NNN REIT stock logo

44. NNN REIT NYSE:NNN

$41.39 -0.37 (-0.89%)
Closing price 11/11/2026 03:59 PM Eastern
Extended Trading
$42.05 +0.66 (+1.59%)
As of 08:18 AM Eastern
Extended trading is trading that happens on electronic markets outside of regular trading hours. This is a fair market value extended hours price provided by Massive. Learn more.

NNN REIT invests primarily in high-quality retail properties subject generally to long-term, net leases. As of December 31, 2023, the company owned 3,532 properties in 49 states with a gross leasable area of approximately 36.0 million square feet and a weighted average remaining lease term of 10.1 years. NNN is one of only three publicly traded REITs to have increased annual dividends for 34 or more consecutive years.

Market Capitalization
$8.10 billion
P/E Ratio
19.71
Consensus Rating
Hold
Consensus Price Target
$46.56 (+12.5% Upside)
Volume
1.85 million shares
Average Volume
2.96 million shares
Today's Range
$41.05
▼
$41.55
50-Day Range
$39.77
▼
$45.15
52-Week Range
$38.90
▼
$50.00
Dividend Yield
5.95%
Rexford Industrial Realty stock logo

45. Rexford Industrial Realty NYSE:REXR

$37.88 -0.07 (-0.19%)
Closing price 11/11/2026 03:59 PM Eastern
Extended Trading
$38.19 +0.31 (+0.82%)
As of 08:25 AM Eastern
Extended trading is trading that happens on electronic markets outside of regular trading hours. This is a fair market value extended hours price provided by Massive. Learn more.

Rexford Industrial Realty, Inc. is a self-administered and self-managed real estate investment trust, which engages in owning and operating industrial properties in infill markets. The company was founded by Richard S. Ziman on January 18, 2013 and is headquartered in Los Angeles, CA.

Market Capitalization
$8.05 billion
P/E Ratio
N/A
Consensus Rating
Hold
Consensus Price Target
$41.14 (+8.6% Upside)
Volume
1.46 million shares
Average Volume
2.76 million shares
Today's Range
$37.50
▼
$37.99
50-Day Range
$36.04
▼
$39.23
52-Week Range
$32.14
▼
$42.41
Dividend Yield
4.59%
Lineage stock logo

46. Lineage NASDAQ:LINE

$35.40 +0.52 (+1.49%)
Closing price 11/11/2026 04:00 PM Eastern
Extended Trading
$35.43 +0.03 (+0.08%)
As of 08:21 AM Eastern
Extended trading is trading that happens on electronic markets outside of regular trading hours. This is a fair market value extended hours price provided by Massive. Learn more.

Lineage, Inc. is the world's largest global temperature-controlled warehouse REIT with a network of over 480 strategically located facilities totaling over 84.1 million square feet and 3.0 billion cubic feet of capacity across countries in North America, Europe, and Asia-Pacific. Coupling end-to-end supply chain solutions and technology, Lineage partners with some of the world's largest food and beverage producers, retailers, and distributors to help increase distribution efficiency, advance sustainability, minimize supply chain waste, and, most importantly, feed the world.

Market Capitalization
$7.94 billion
P/E Ratio
88.50
Consensus Rating
Hold
Consensus Price Target
$41.73 (+17.9% Upside)
Volume
1.19 million shares
Average Volume
1.12 million shares
Today's Range
$34.36
▼
$35.68
50-Day Range
$33.22
▼
$39.66
52-Week Range
$31.33
▼
$45.75
Dividend Yield
5.37%
Alexandria Real Estate Equities stock logo

47. Alexandria Real Estate Equities NYSE:ARE

$45.07 +0.37 (+0.84%)
Closing price 11/11/2026 03:59 PM Eastern
Extended Trading
$45.21 +0.14 (+0.30%)
As of 08:39 AM Eastern
Extended trading is trading that happens on electronic markets outside of regular trading hours. This is a fair market value extended hours price provided by Massive. Learn more.

Alexandria Real Estate Equities, Inc (NYSE: ARE), an S&P 500 company, is a best-in-class, mission-driven life science REIT making a positive and lasting impact on the world. More about Alexandria Real Estate Equities

Pros of Alexandria Real Estate Equities

  • The stock currently trades at $45.22, which is significantly below the consensus price target of $49.36, suggesting potential upside for investors who believe the market is currently undervaluing the company's assets.
  • Investors can benefit from a high dividend yield of 6.26%, which provides a substantial income stream relative to the current share price, making it an attractive option for income-focused portfolios.
  • Strategic partnerships are strengthening the company's balance sheet, as evidenced by KKR's recent $475 million investment in the Campus Point joint venture, which provides capital for development and reduces financial risk.

Cons of Alexandria Real Estate Equities

  • The company reported a significant earnings miss in the most recent quarter, with actual EPS of -$3.74 compared to a consensus estimate of -$0.03, indicating substantial financial losses that may deter growth-oriented investors.
  • Revenue is declining, with the most recent quarter showing a 10.7% year-over-year decrease, which suggests weakening demand or pricing pressure in the life science real estate market.
  • Analyst sentiment has turned negative, with the consensus rating downgraded to "Reduce" and multiple firms, including JPMorgan Chase and BNP Paribas Exane, lowering their price targets and ratings in late 2026.
A.I. GeneratedThese insights were generated using artificial intelligence. They are based on proprietary MarketBeat data, news articles, and custom LLM A.I. algorithms.
Market Capitalization
$7.78 billion
P/E Ratio
N/A
Consensus Rating
Reduce
Consensus Price Target
$49.79 (+10.5% Upside)
Volume
1.91 million shares
Average Volume
2.82 million shares
Today's Range
$43.47
▼
$45.54
50-Day Range
$39.82
▼
$56.33
52-Week Range
$38.34
▼
$59.76
Dividend Yield
6.44%
Compass stock logo

48. Compass NYSE:COMP

$10.24 +0.26 (+2.55%)
Closing price 11/11/2026 03:59 PM Eastern
Extended Trading
$10.04 -0.20 (-1.95%)
As of 08:49 AM Eastern
Extended trading is trading that happens on electronic markets outside of regular trading hours. This is a fair market value extended hours price provided by Massive. Learn more.

Compass, Inc. provides real estate brokerage services in the United States. It operates a cloud-based platform that provides an integrated suite of software for customer relationship management, marketing, client service, operations, and other functionality in the real estate industry. The company offers mobile apps that allow agents to manage their business anytime and anywhere, as well as designs consumer-grade user interfaces, automated and simplified workflows for agent-client interactions, and insight-rich dashboards and reports. It also provides full-service title and escrow/settlement services to real estate agents' clients, real estate companies, and financial institutions relating to the closing of home purchases as well as the refinancing of home loans; and Compass Concierge, a program in which home sellers access to capital to front the cost of home improvement services. The company was formerly known as Urban Compass, Inc. and changed its name to Compass, Inc. in January 2021.Compass, Inc. was incorporated in 2012 and is headquartered in New York, New York.

Market Capitalization
$7.57 billion
P/E Ratio
73.18
Consensus Rating
Moderate Buy
Consensus Price Target
$13.07 (+27.6% Upside)
Volume
12.16 million shares
Average Volume
15.46 million shares
Today's Range
$9.80
▼
$10.27
50-Day Range
$8.75
▼
$11.14
52-Week Range
$6.37
▼
$13.95
Dividend Yield
N/A
Terreno Realty stock logo

49. Terreno Realty NYSE:TRNO

$67.22 +0.19 (+0.28%)
Closing price 11/11/2026 03:59 PM Eastern
Extended Trading
$67.30 +0.08 (+0.12%)
As of 11/11/2026 07:56 PM Eastern
Extended trading is trading that happens on electronic markets outside of regular trading hours. This is a fair market value extended hours price provided by Massive. Learn more.

Terreno Realty Corporation (Terreno, and together with its subsidiaries, the Company) acquires, owns and operates industrial real estate in six major coastal U.S. markets: Los Angeles, Northern New Jersey/New York City, San Francisco Bay Area, Seattle, Miami, and Washington, D.C. All square feet, acres, occupancy and number of properties disclosed in these notes to the consolidated financial statements are unaudited. As of December 31, 2023, the Company owned 259 buildings aggregating approximately 16.0 million square feet, 45 improved land parcels consisting of approximately 152.4 acres, seven properties under development or redevelopment and approximately 62.7 acres of land entitled for future development. The Company is an internally managed Maryland corporation and elected to be taxed as a real estate investment trust (REIT) under Sections 856 through 860 of the Internal Revenue Code of 1986, as amended (the Code), commencing with its taxable year ended December 31, 2010.

Market Capitalization
$7.40 billion
P/E Ratio
20.07
Consensus Rating
Moderate Buy
Consensus Price Target
$73.88 (+9.9% Upside)
Volume
586,652 shares
Average Volume
804,871 shares
Today's Range
$66.30
▼
$67.32
50-Day Range
$63.34
▼
$68.01
52-Week Range
$57.95
▼
$78.94
Dividend Yield
3.40%
First Industrial Realty Trust stock logo

50. First Industrial Realty Trust NYSE:FR

$55.27 +0.31 (+0.56%)
Closing price 11/11/2026 03:59 PM Eastern
Extended Trading
$55.26 0.00 (-0.01%)
As of 04:02 AM Eastern
Extended trading is trading that happens on electronic markets outside of regular trading hours. This is a fair market value extended hours price provided by Massive. Learn more.

First Industrial Realty Trust, Inc. (NYSE: FR) is a leading U.S.-only owner, operator, developer and acquirer of logistics properties. Through our fully integrated operating and investing platform, we provide high quality facilities and industry-leading customer service to multinational corporations and regional firms that are essential for their supply chains. Our portfolio and new investments are concentrated in 15 target MSAs with an emphasis on supply-constrained, coastally oriented markets. In total, we own and have under development approximately 68.5 million square feet of industrial space as of December 31, 2023.

Market Capitalization
$7.29 billion
P/E Ratio
20.55
Consensus Rating
Hold
Consensus Price Target
$64.93 (+17.5% Upside)
Volume
1.26 million shares
Average Volume
1.96 million shares
Today's Range
$54.62
▼
$55.50
50-Day Range
$53.79
▼
$62.41
52-Week Range
$53.27
▼
$69.88
Dividend Yield
3.64%