AT&T Today
T
AT&T
$21.79 -0.19 (-0.88%) As of 07/17/2026 03:59 PM Eastern
This is a fair market value price provided by Massive. Learn more. - 52-Week Range
- $19.89
▼
$29.79 - Dividend Yield
- 5.10%
- P/E Ratio
- 7.31
- Price Target
- $29.34
On paper, a company that just turned 141 years old and increased its net income from $10.7 billion in 2024 to $21.9 billion in 2025 may not seem like a likely sell candidate.
That argument gets even harder to make when considering that its stock is up nearly 12% this year, its forward price-to-earnings (P/E) multiple is 12.88, its net profit margin is more than 17%, and it's operating at a beta of 0.39—making it nearly 61% less volatile than the broad market.
But when it comes to communication services mainstay AT&T NYSE: T, it might be time for swing traders and momentum traders to consider locking in profits as a regression to the stock’s moving averages could very likely be in the cards.
A Combination of Short-Term Technical Indicators Are Flashing Warning Signs
In November 2025, the moving averages on AT&T’s one-year chart formed a bearish death cross. However, rather than plummeting when the 200-day moving average (MA) crossed over the 50-day MA, the stock mostly traded in a range.
That was until Jan. 27, when shares of T shot up more than 25% through Feb. 12 in defiance of both the 50- and 200-day MAs. At the time of that run-up in price, the stock’s Relative Strength Index (RSI) reading pushed as high as 81.89.
The catalyst for that defiant run-up was the telecom company’s full-year and Q4 2025 earnings report on Jan. 28, when AT&T announced earnings per share (EPS) of 52 cents, which beat analyst expectations of 46 cents, and quarterly revenue of $33.47 billion, which beat analyst expectations of $32.91 billion.
But the rally was propelled by earnings season fervor more than it was by sound fundamentals. And when a stock’s RSI pushes that far above 70, it is typically indicative of being overbought and therefore due for a bearish price reversal.
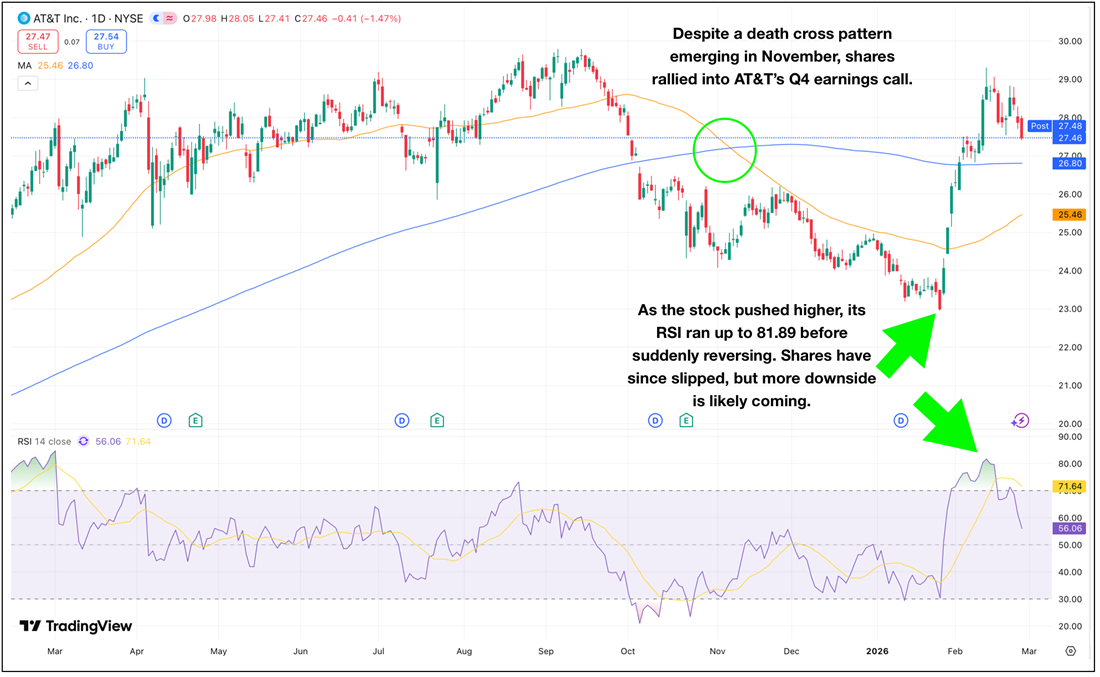
That is exactly what happened on the days that followed, with AT&T’s RSI being pushed down to its present 56.06. Over the same period, shares have lost nearly 5%, and there could be more than 7% additional downside potential until the stock tests its 50-day moving average around $25.46.
For short-term traders who saw the pullback materializing, most of those earnings-induced profits could have been locked in. For those who ignored it, the company’s financials could spell more trouble ahead.
Uninspiring Revenue Growth and a Stagnant Dividend Are Cautionary Tales
Beyond technicals, the company's financial metrics are failing to inspire hope for those reading between the lines. As previously mentioned, AT&T’s P/E multiple of 12.88 suggests value, but not necessarily in the short term.
The telecom firm’s nearly 105% increase in year-over-year net income growth—from $10.7 billion in 2024 to $21.9 billion in 2025—is a bit of an outlier. Excluding 2025’s performance, AT&T’s five-year average net income is $6.14 billion, which is more than 72% lower than 2025’s net income.
The same can be said for AT&T’s stagnant revenue growth. Over the past five years, that figure stands at -2.83%, including contractions in three out of five years (2021, 2022, and 2024).
The stock’s stagnant dividend is also a warning. AT&T cut its payout by nearly 50% in 2022, when it was yielding 7.65%. On a quarterly basis, that cut took the per-share payout from 52 cents to 27 cents. That has mostly held steady as the company’s management has prioritized debt reduction and balance sheet repair.
Long term, AT&T may find the right balance to enable it to once again increase its payout. But for the purpose of this analysis, its dividend—which has an annualized five-year growth rate of -11.80%—is less of a warning to income investors as it is a symptom of financial stress that short-term traders should continue to monitor.
Even with the yield reduction, AT&T’s net cash from financing activities has been negative for several quarters, including -$8.78 billion in Q4 2025, underscoring the company’s ongoing struggle with substantial cash outflows for dividends, debt service, and other financing activities.
Meanwhile, in its recent earnings call, the company disclosed that near-term leverage will cause adjusted earnings before interest, taxes, depreciation, and amortization (EBITDA) to decline more than threefold by year’s end after the acquisition of Lumen Technologies’ NYSE: LUMN mass market fiber business closes—the fruits of which will not positively affect EBITDA until around 2028.
Wall Street’s Sentiment Remains Positive
AT&T MarketRank™ Stock Analysis
- Overall MarketRank™
- 99th Percentile
- Analyst Rating
- Moderate Buy
- Upside/Downside
- 34.7% Upside
- Short Interest Level
- Healthy
- Dividend Strength
- Strong
- News Sentiment
- 0.68

- Insider Trading
- N/A
- Proj. Earnings Growth
- 9.91%
See Full AnalysisDespite the company’s ongoing issues, Wall Street remains mostly bullish on the stock. Of the 23 analysts currently covering T, 15 rate it Buy. Overall, it receives a Moderate Buy rating with a consensus one-year price target of $29.93.
The current short interest of 1.60%, or just over 11 million shares of the 7 billion shares outstanding, is more than 14% lower than a month ago. And despite institutional ownership of 57.10% lower than the average for large-cap stocks, inflows of more than $24 billion over the past 12 months have more than doubled outflows of just over $10 billion.
Still, institutional selling in Q4 was higher than it has been at any point over the past three years.
Before you consider AT&T, you'll want to hear this.
MarketBeat keeps track of Wall Street's top-rated and best performing research analysts and the stocks they recommend to their clients on a daily basis. MarketBeat has identified the five stocks that top analysts are quietly whispering to their clients to buy now before the broader market catches on... and AT&T wasn't on the list.
While AT&T currently has a Moderate Buy rating among analysts, top-rated analysts believe these five stocks are better buys.
View The Five Stocks Here
Nuclear energy is entering a new growth cycle as rising power demand, expanding data centers, and renewed policy support bring the sector back into focus. After strong gains in recent years, the most impactful phase of nuclear investment may still be ahead.
This report highlights seven nuclear energy stocks positioned across the value chain—combining near-term revenue with long-term upside as next-generation technologies scale. Click the link below to unlock the full list.
Get This Free Report
