Free Trial
Memorial Day Savings! Save $100 on MarketBeat All Access
Claim Your Discount
Claim MarketBeat All Access Sale Promotion

Canadian Penny Stocks

The table below lists Canadian penny stocks trading under $1.00 with the highest volume from the most recent trading day.

This list updates as markets shift, providing a quick snapshot for investors.

Sort by price, volume, or market cap to find stocks that fit your strategy.

Penny stocks are companies with share prices under $1.00 and market caps under $100 million, often appealing for their potential upside.

MarketRank™ evaluates a company based on dividend strength, earnings, valuation, analysts forecasts, and more.
Available with a MarketBeat All Access Subscription
MarketRank™Upgrade to All Access to use the All Ranks Filter
Media sentiment refers to the percentage of positive news stories versus negative news stories a company has received in the past week.
Available with a MarketBeat All Access Subscription
Media SentimentUpgrade to All Access to use the All Sentiments Filter
Analyst consensus is the average investment recommendation among Wall Street research analysts.
Available with a MarketBeat All Access Subscription
Analyst ConsensusUpgrade to All Access to use the All Ratings Filter
CompanyCurrent PriceP/E RatioMarket CapVolumeAverage VolumeIndicator(s)
Honey Badger Silver Inc. stock logo
TUF
Honey Badger Silver
C$0.86
-2.8%
N/AC$133.35 millionC$2.55 millionC$660.53 thousand
Global Atomic Co. stock logo
GLO
Global Atomic
C$0.68
-4.2%
N/AC$333.39 millionC$1.72 millionC$1.65 million
VGO
53693 (VGO.V)
C$0.89
+20.3%
N/AC$64.52 millionC$1.48 millionC$471.14 thousand
ESU
EEStor Co. (ESU.V)
C$0.19
-11.9%
N/AC$31.44 millionC$1.44 millionC$245.21 thousand
dynaCERT Inc stock logo
DYA
dynaCERT
C$0.74
+7.2%
N/AC$264.50 millionC$1.33 millionC$844.24 thousand
Sintana Energy Inc. stock logo
SEI
Sintana Energy
C$0.45
-8.2%
N/AC$229.08 millionC$1.33 millionC$304.34 thousand
Tudor Gold Corp. stock logo
TUD
Tudor Gold
C$0.90
-9.1%
N/AC$368.23 millionC$1.30 millionC$909.47 thousand
First Mining Gold Corp. stock logo
FF
First Mining Gold
C$0.48
-4.0%
N/AC$664.30 millionC$1.16 millionC$2.03 million
Volatus Aerospace Inc. stock logo
FLT
Volatus Aerospace
C$0.67
-1.5%
N/AC$453.35 millionC$1.15 millionC$1.37 million
ILA
iLOOKABOUT Corp. (ILA.V)
C$0.59
+15.7%
N/AC$96.75 millionC$1.03 millionC$1.23 million
Your $29.97 book is free today (Ad)

Why Some Traders Skip Stocks Entirely You don't need a big account to trade options. In fact, options can give you up to 12 times the leverage of stocks — with a fraction of the capital tied up. This free guide lays it all out in plain English — from A to Z, with step-by-step examples you can follow in your own account.tc pixel

Normally $29.97. Today it's free. Grab your copy now.
Renaissance Oil Corp. stock logo
ROE
Renaissance Oil
C$0.51
+3.0%
N/AC$190.57 millionC$1.02 millionC$659.39 thousand
Power Metals Corp. stock logo
PWM
Power Metals
C$0.53
+14.0%
N/AC$92.49 millionC$810.29 thousandC$107.93 thousand
Plateau Energy Metals Inc. stock logo
PLU
Plateau Energy Metals
C$0.65
-3.0%
N/AC$75.94 millionC$804.30 thousandC$303.54 thousand
Silver X Mining Corp. stock logo
AGX
Silver X Mining
C$0.70
-7.9%
N/AC$185.92 millionC$696.83 thousandC$1.18 million
Trek Mining Inc stock logo
TREK
Trek Mining
C$0.98
+7.7%
N/AC$174.39 millionC$695.69 thousandC$185.36 thousand
Falcon Oil & Gas Ltd. stock logo
FO
Falcon Oil & Gas
C$0.34
N/AC$371.56 millionC$685.51 thousandC$320.91 thousand
Auxly Cannabis Group Inc. stock logo
XLY
Auxly Cannabis Group
C$0.39
+5.4%
N/AC$289.90 millionC$635.97 thousandC$876.95 thousand
Barksdale Resources Corp. stock logo
BRO
Barksdale Resources
C$0.52
N/AC$107.17 millionC$625.54 thousandC$250.39 thousand
Mega Uranium Ltd. stock logo
MGA
Mega Uranium
C$0.62
-10.1%
62.00C$235.49 millionC$622.67 thousandC$720.53 thousand
Zentek Ltd. stock logo
ZEN
Zentek
C$0.99
+6.5%
N/AC$106.47 millionC$617.17 thousandC$94.17 thousand
Reunion Gold Co. stock logo
RGD
Reunion Gold
C$0.73
N/AC$914.13 millionC$608.97 thousandC$654.72 thousand
Revival Gold Inc. stock logo
RVG
Revival Gold
C$0.76
-6.2%
N/AC$236.98 millionC$600.88 thousandC$392.08 thousand
First Atlantic Nickel Corp. stock logo
FAN
First Atlantic Nickel
C$0.72
-3.4%
N/AC$92.01 millionC$517.52 thousandC$500.91 thousand
GoviEx Uranium Inc. stock logo
GXU
GoviEx Uranium
C$0.04
+7.5%
N/AC$43.95 millionC$469.19 thousandC$89.57 thousand
BFD
Beaufield Resources
C$0.15
+7.4%
N/AC$30.95 millionC$443.59 thousandC$31.51 thousand
Lithium Ionic Corp. stock logo
LTH
Lithium Ionic
C$0.96
-5.9%
N/AC$166.80 millionC$440.87 thousandC$498.36 thousand
Generation Mining Limited stock logo
GENM
Generation Mining
C$0.59
-6.3%
N/AC$189.47 millionC$440.72 thousandC$629.04 thousand
Logan Energy Corp. stock logo
LGN
Logan Energy
C$0.96
-1.0%
24.00C$663.91 millionC$434.74 thousandC$627.20 thousand
Glacier Media Inc. stock logo
GVC
Glacier Media
C$0.33
-2.9%
6.74C$43.27 millionC$429.02 thousandC$17.87 thousand
Falco Resources Ltd. stock logo
FPC
Falco Resources
C$0.47
-13.0%
N/AC$163.27 millionC$395.61 thousandC$226.18 thousand
CEMATRIX Co. stock logo
CVX
CEMATRIX
C$0.51
+4.1%
25.50C$69.24 millionC$379.74 thousandC$104.62 thousand
RM
Routemaster Capital Inc. (RM.V)
C$0.83
+1.2%
15.09C$84.26 millionC$377.85 thousandC$773.59 thousand
Theralase Technologies Inc. stock logo
TLT
Theralase Technologies
C$0.22
-4.3%
N/AC$60.68 millionC$372.57 thousandC$64.16 thousand
Southern Silver Exploration Corp. stock logo
SSV
Southern Silver Exploration
C$0.52
-8.8%
N/AC$212.29 millionC$352.65 thousandC$725.19 thousand
Cabral Gold Inc. stock logo
CBR
Cabral Gold
C$0.92
-6.1%
N/AC$277.30 millionC$350.55 thousandC$419.26 thousand
ID Watchdog, Inc stock logo
IDW
ID Watchdog
C$0.49
-2.0%
N/AC$70.31 millionC$346.09 thousandC$104.61 thousand
Starcore International Mines Ltd. stock logo
SAM
Starcore International Mines
C$0.61
-15.3%
15.25C$55.11 millionC$335.74 thousandC$249.71 thousand
Spanish Mountain Gold Ltd. stock logo
SPA
Spanish Mountain Gold
C$0.36
-7.8%
N/AC$181.29 millionC$328.79 thousandC$313.45 thousand
Skyharbour Resources Ltd. stock logo
SYH
Skyharbour Resources
C$0.44
-8.3%
440.00C$93.32 millionC$318.97 thousandC$332.38 thousand
ROK Resources Inc. stock logo
ROK
ROK Resources
C$0.30
N/AC$64.24 millionC$309.33 thousandC$233.35 thousand
Your $29.97 book is free today (Ad)

Why Some Traders Skip Stocks Entirely You don't need a big account to trade options. In fact, options can give you up to 12 times the leverage of stocks — with a fraction of the capital tied up. This free guide lays it all out in plain English — from A to Z, with step-by-step examples you can follow in your own account.tc pixel

Normally $29.97. Today it's free. Grab your copy now.
Pure Gold Mining Inc. stock logo
PGM
Pure Gold Mining
C$0.02
N/AC$10.93 millionC$297.92 thousandC$25.64 thousand
SDX Energy Inc stock logo
SDX
SDX Energy
C$0.37
-5.1%
370.00C$75.75 millionC$290.08 thousandC$45.19 thousand
Small Pharma Inc. stock logo
DMT
Small Pharma
C$0.15
-6.3%
N/AC$50.37 millionC$283.61 thousandC$44.42 thousand
Sokoman Minerals Corp. stock logo
SIC
Sokoman Minerals
C$0.20
+8.1%
N/AC$90.70 millionC$277.47 thousandC$134.28 thousand
Sherritt International Co. stock logo
S
Sherritt International
C$0.12
+9.1%
N/AC$84.40 millionC$275.66 thousandC$157.28 thousand
Coelacanth Energy Inc. stock logo
CEI
Coelacanth Energy
C$0.85
N/AC$538.62 millionC$268.66 thousandC$153.19 thousand
Terraco Gold Corp stock logo
TEN
Terraco Gold
C$0.15
-3.3%
N/AC$26.44 millionC$266.50 thousandC$30.27 thousand
Stillwater Critical Minerals Corp. stock logo
PGE
Stillwater Critical Minerals
C$0.30
-4.8%
N/AC$93.26 millionC$266.41 thousandC$285.32 thousand
Avanti Helium Corp. stock logo
AVN
Avanti Helium
C$0.48
-4.0%
N/AC$61.03 millionC$264.66 thousandC$304.63 thousand
Goldquest Mining Corp. stock logo
GQC
Goldquest Mining
C$0.45
-2.2%
N/AC$170.35 millionC$264.46 thousandC$277.46 thousand
Red Moon Resources Inc. stock logo
RMK
Red Moon Resources
C$0.95
+3.3%
N/AC$70.21 millionC$252.26 thousandC$255.95 thousand
Adventus Mining Co. stock logo
ADZN
Adventus Mining
C$0.45
-4.3%
N/AC$140.73 millionC$248.00 thousandC$337.07 thousand
Amarillo Gold Co. stock logo
AGC
Amarillo Gold
C$0.44
+2.4%
N/AC$167.94 millionC$246.82 thousandC$144.96 thousand
Monument Mining Limited stock logo
MMY
Monument Mining
C$0.82
-5.7%
5.13C$283.80 millionC$246.24 thousandC$569.82 thousand
Galantas Gold Co. stock logo
GAL
Galantas Gold
C$0.46
-4.2%
N/AC$211.08 millionC$244.20 thousandC$1.26 million
JCO
Jericho Energy Ventures
C$0.94
-1.1%
N/AC$167.89 millionC$239.22 thousandC$246.63 thousand
Medicenna Therapeutics Corp. stock logo
MDNA
Medicenna Therapeutics
C$0.47
-13.0%
N/AC$39.21 millionC$228.35 thousandC$53.83 thousand
Galway Metals Inc. stock logo
GWM
Galway Metals
C$0.54
-7.7%
N/AC$67.91 millionC$227.95 thousandC$323.15 thousand
LexaGene Holdings Inc. stock logo
LXG
LexaGene
C$0.11
-19.2%
N/AC$14.77 millionC$224.21 thousandC$17.86 thousand
Solo Growth Corp. stock logo
ALZ
Solo Growth
C$0.06
+9.1%
N/AC$40.20 millionC$218.59 thousandC$100.87 thousand
Sirios Resources Inc. stock logo
SOI
Sirios Resources
C$0.20
-2.4%
N/AC$128.12 millionC$215.77 thousandC$164.84 thousand
Hillcrest Petroleum Ltd. stock logo
HRH
Hillcrest Petroleum
C$0.22
+10.0%
N/AC$46.26 millionC$212.98 thousandC$741.96 thousand
Oroco Resource Corp. stock logo
OCO
Oroco Resource
C$0.40
-7.0%
N/AC$130.38 millionC$204.18 thousandC$378.19 thousand
D-BOX Technologies Inc. stock logo
DBO
D-BOX Technologies
C$0.86
-3.4%
12.11C$191.73 millionC$202.70 thousandC$480.87 thousand
Laramide Resources Ltd. stock logo
LAM
Laramide Resources
C$0.64
-8.6%
N/AC$181.54 millionC$201.29 thousandC$304.26 thousand
TNR Gold Corp. stock logo
TNR
TNR Gold
C$0.23
-2.1%
N/AC$49.33 millionC$201.09 thousandC$88.75 thousand
Atlas Engineered Products Ltd. stock logo
AEP
Atlas Engineered Products
C$0.71
+12.7%
N/AC$49.91 millionC$193.63 thousandC$45.84 thousand
Altura Energy Inc. stock logo
ATU
Altura Energy
C$0.38
+5.6%
4.52C$103.67 millionC$192.90 thousandC$92.36 thousand
NSE
New Stratus Energy
C$0.76
-1.3%
N/AC$102.93 millionC$191.87 thousandC$213.93 thousand
AXL
Front Range Resources
C$0.44
-4.3%
13.67C$125.78 millionC$189.91 thousandC$250.77 thousand
Oceanic Iron Ore Corp. stock logo
FEO
Oceanic Iron Ore
C$0.85
+13.3%
N/AC$221.53 millionC$179.69 thousandC$107.72 thousand
Protech Home Medical Corp. stock logo
PHM
Protech Home Medical
C$0.12
-4.2%
57.50C$47.90 millionC$175.83 thousandC$136.34 thousand
Wallbridge Mining Company Limited stock logo
WM
Wallbridge Mining
C$0.08
N/AC$91.69 millionC$167.51 thousandC$81.08 thousand
Silver One Resources Inc. stock logo
SVE
Silver One Resources
C$0.48
-8.7%
N/AC$167.69 millionC$164.96 thousandC$296.42 thousand
Osisko Metals Incorporated stock logo
OM
Osisko Metals
C$0.42
+5.1%
N/AC$116.17 millionC$164.61 thousandC$248.58 thousand
Stampede Drilling Inc. stock logo
SDI
Stampede Drilling
C$0.22
11.00C$43.16 millionC$162.86 thousandC$26.40 thousand
Premium Nickel Resources Ltd. stock logo
PNRL
Premium Nickel Resources
C$0.47
N/AC$87.28 millionC$162.62 thousandC$123.80 thousand
CHAR Technologies Ltd. stock logo
YES
CHAR Technologies
C$0.31
106.90C$41.44 millionC$161.03 thousandC$49.04 thousand
CanAsia Energy Corp. stock logo
CEC
CanAsia Energy
C$0.33
-13.2%
N/AC$37.22 millionC$159.76 thousandC$93.88 thousand
K2 Gold Co. stock logo
KTO
K2 Gold
C$0.75
-3.8%
N/AC$181.35 millionC$151.04 thousandC$238.30 thousand
DMG Blockchain Solutions Inc. stock logo
DMGI
DMG Blockchain Solutions
C$0.30
-3.3%
N/AC$60.87 millionC$149.44 thousandC$110.40 thousand
Superior Gold Inc. stock logo
SGI
Superior Gold
C$0.20
+2.6%
N/AC$24.07 millionC$149.23 thousandC$28.90 thousand
Defiance Silver Corp. stock logo
DEF
Defiance Silver
C$0.21
-3.3%
N/AC$76.68 millionC$149.21 thousandC$319.54 thousand
Max Resource Corp. stock logo
MXR
Max Resource
C$0.42
-5.7%
N/AC$40.71 millionC$148.32 thousandC$118.36 thousand
Canadian Gold Corp. stock logo
CGC
Canadian Gold
C$0.60
-6.3%
N/AC$126.35 millionC$146.19 thousandC$178.36 thousand
BluMetric Environmental Inc. stock logo
BLM
BluMetric Environmental
C$0.81
-9.0%
N/AC$44.22 millionC$144.74 thousandC$64.84 thousand
First Cobalt Corp. stock logo
FCC
First Cobalt
C$0.31
-1.6%
N/AC$162.97 millionC$141.37 thousandC$356.55 thousand
IMPACT Silver Corp. stock logo
IPT
IMPACT Silver
C$0.26
-13.6%
N/AC$88.10 millionC$140.62 thousandC$368.52 thousand
Eastern Platinum Limited stock logo
ELR
Eastern Platinum
C$0.40
-9.2%
N/AC$81.33 millionC$138.04 thousandC$146.78 thousand
GRR
Golden Reign Resources
C$0.20
+5.3%
N/AC$38.43 millionC$136.92 thousandC$26.23 thousand
Your $29.97 book is free today (Ad)

Why Some Traders Skip Stocks Entirely You don't need a big account to trade options. In fact, options can give you up to 12 times the leverage of stocks — with a fraction of the capital tied up. This free guide lays it all out in plain English — from A to Z, with step-by-step examples you can follow in your own account.tc pixel

Normally $29.97. Today it's free. Grab your copy now.
YRB
Yorbeau Resources
C$0.06
+9.1%
1.71C$28.52 millionC$136.73 thousandC$10.25 thousand
Critical Elements Lithium Co. stock logo
CRE
Critical Elements Lithium
C$0.40
-1.3%
N/AC$91.66 millionC$136.13 thousandC$80.87 thousand
MTO
Metanor Resources Inc. (MTO.V)
C$0.58
N/AC$59.13 millionC$134.79 thousandC$46.64 thousand
Scorpio Gold Co. stock logo
SGN
Scorpio Gold
C$0.37
-7.5%
37.00C$111.96 millionC$134.53 thousandC$214.54 thousand
Orca Gold Inc. stock logo
ORG
Orca Gold
C$0.83
-4.6%
N/AC$216.51 millionC$133.35 thousandC$440.78 thousand
ATAC Resources Ltd. stock logo
ATC
ATAC Resources
C$0.13
N/AC$27.69 millionC$132.50 thousandC$75.64 thousand
Red Pine Exploration Inc. stock logo
RPX
Red Pine Exploration
C$0.20
-1.0%
N/AC$73.79 millionC$131.63 thousandC$174.13 thousand
MX Gold Corp. stock logo
MXL
MX Gold
C$0.11
+∞
N/AC$31.40 millionC$128.52 thousandC$313.09 thousand
CanAlaska Uranium Ltd. stock logo
CVV
CanAlaska Uranium
C$0.57
-6.6%
N/AC$125.47 millionC$127.59 thousandC$316.72 thousand
CMM
102535 (CMM.V)
C$0.69
+∞
N/AC$26.19 millionC$125.46 thousandC$168.47 thousand

Got some speculative cash you're willing to gamble for a potential multi-bagger profit? Or do you have a small brokerage account with risk capital that you want to multiply? The upside may sound appealing as long as you are fine with the downside of investing in the market's riskiest type of stocks. 

The stock market tends to make rewards proportionate to risk. The more you risk, the higher your potential for reward. If you have an appetite for increased risk for high rewards, consider trading Canadian penny stocks. It's prudent to be aware of its risks, and you should be able to go into it with your eyes wide open after reading this article. 

What is a Penny Stock?

Penny stocks are a term for trading under $5 per share. Usually, these stocks have low prices because they tend to be in the early stages of development or their business fundamentals have cratered. Many penny stocks are fraudulent or shady as there is less information on the business operations due to the less stringent reporting requirements. This leaves much room for shady operators to manipulate these stocks. 

Many of these stocks are shell companies that provide some legitimate companies to reverse merge into them, like a snail taking on a new shell as a home. Penny stocks can range in price from fractions of a penny to $5. The hope for speculators is to find a penny stock that will become a significant business as more investors rush into the shares, ballooning its price. The thinking that the market overlooked or mispriced these stocks drives penny stock speculation.  

canadian penny stocks

How to Find Canadian Penny Stocks 

Finding Canadian penny stocks to buy starts with looking at the exchanges. While some penny stocks trade on the Toronto Stock Exchange (TSX), it's mainly reserved for more extensive and more established companies with a minimum valuation of $50 million or more. Companies with much smaller market caps tend to be riskier and don't qualify to trade on a major exchange like the TSX. These penny stocks often trade on over-the-counter exchanges, accommodating riskier companies.  

You can find most Canadian penny stocks on the smaller TSX Venture Exchange (TSXV) and the Canadian Securities Exchange (CSE). The TSXV and CSE stocks tend to be smaller emerging companies and start-ups without a track record. These stocks are risky due to the lack of transparency about the company and a lack of liquidity. 

Liquidity refers to how quickly and efficiently a stock can be bought and sold at a fair price. Fair price refers to having a tight spread between the bid and ask price. A liquid stock will have a spread that's only a few pennies apart between the bid and ask price. For example, XYZ is liquid because the spread is only two cents between the $3.20 bid price and the $3.22 ask price. You can find individual TSX penny stocks and TSX OTC (over-the-counter) stocks in several ways.

Step 1: Use a stock screener. 

The evolution of computer technology and trading software has made scanning and finding potential penny stocks more manageable than ever. Most brokerage platforms have some stock screener. You can find them online as well. When creating filters, it's essential to set the search for stocks priced at $5 and below. It also helps narrow the search to stocks on the TSXV and CSE.

Step 2: Use MarketBeat to get Ideas and use its tools for research.

MarketBeat has many tools to find the best Canadian penny stocks to buy now. You can start by familiarizing yourself with established TSX stock price targets and analyst ratings. You can search for Canadian stocks on MarketBeat and search for stocks hitting Canada's 52-week highs. Once you understand the larger market cap stocks, you can learn how to start investing in penny stocks. It's prudent to start with well-known, established stocks before diving into penny stocks. It's also important to be aware of Canada stock market holidays

Most new traders invest in penny stocks when they should learn how blue chip stocks operate, then work their way down to the riskier stuff. 

Step 3: Subscribe to newsletters for ideas after taking a free trial.

Numerous stock picking and newsletter services provide penny stock candidates to speculate in. It's a good idea to test out the services that offer a free trial period. This allows you to look at their track record and the picks' historical performance before considering a subscription. 

Not all newsletters offer a free trial. The ones that do offer a free trial are more transparent, which is a rarity when it comes to penny stocks. Read the fine print and cancel the trial before the billing period begins if you wish to refrain from signing up. 

Even if you sign up, be mindful of their cancellation policy, as some services may require upfront notice or other conditions to cancel a recurring payment. It's wise to only select annual prepayment plans after testing the product sufficiently for some time, as most newsletter services don't offer refunds. 

Step 4: Use social media with your eyes wide open.

Using social media can be tricky due to the anonymous and spam-like nature of social media sites like Twitter. You can search for news or events by adding a "$" to the stock symbol in the search line. These sites can provide timely news, opinions and rumors and post the most active penny stocks for the day. There are a ton of bots, so it can be exhausting to block them constantly. The goal is to find ideas and follow users with a credible history. Most bots are trying to sell you a newsletter, chat room, or advisory service, so be skeptical.  

How to Trade Canadian Penny Stocks

Once you've found some penny stocks Canada candidates, it's time to put the work into motion. Here are the steps to take when trading penny stocks.  

Step 1: Research the company thoroughly. 

Use MarketBeat.com and research the stock with an all-in-one place source. Enter the symbol on the MarketBeat "search for companies, news or tools" tab. This should display the "stock forecast, price and news" page. Read the description of the company and learn about the industry. 

Check the 52-week range to understand where the stock trades. Compare the current volume to the average volume to see if there's a high volume. It usually precedes a strong move in the underlying price. Work your way down the page. You can find some of the best information on the "news headlines" portion.    

Step 2: Research the stock price action.

This step requires technical analysis to gauge support and resistance price levels and trends. Utilizing candlestick charts and various indicators like a 20-period exponential moving average (EMA) and or a 50-period MA helps to determine the trend. The time frame of the charts is also important, ranging from as short as a one-minute chart up to a weekly or monthly candlestick chart. Swing traders can look to use a daily candlestick chart to be able to swing the stocks.

Step 3: Decide on entry and stop-loss price.

As you pinpoint price support and resistance levels and mark them on your chart, you should then plan your entry price or prices. Taking the time to pre-plan your trade lets you avoid impulse trading or chasing entries fueled by emotions. You can be patient and wait for a pullback to a support level to get an entry or even spread out the entries at various price levels to get a better average price on your position. It's also crucial to have a stop-loss price, which is the price where you will sell the stock for a loss to avoid a more significant loss.  

Step 4: Execute and manage the trade.

Once in the trade, you must be disciplined in taking the stop-loss if the stock breaks down. The stop-loss can be based on a support breakdown, trend reversal, or percentage pullback. On that note, using profit targets to take some money off the table and pay yourself if the stock rises is also prudent. Don't get greedy and overlook taking profits. Remember that trading and investing aim to drop the risk to zero, which is only possible by going to cash. How you get there is up to the market and your discipline. 

Canadian Penny Stock Trading Example

Here's an example of applying the steps for trading a Canadian penny stock 5N Plus Inc. (TSE: VNP). The description tells us that VNP is a semiconductor stock headquartered in Montreal, Canada. It's also involved in the performance materials. Going to the MarketBeat "VNP stock forecast, price and news'' page, the volume spiked nearly five times the average volume of 151,000 shares as shares closed at $3.05, rising 10.11% on the last trading day. 

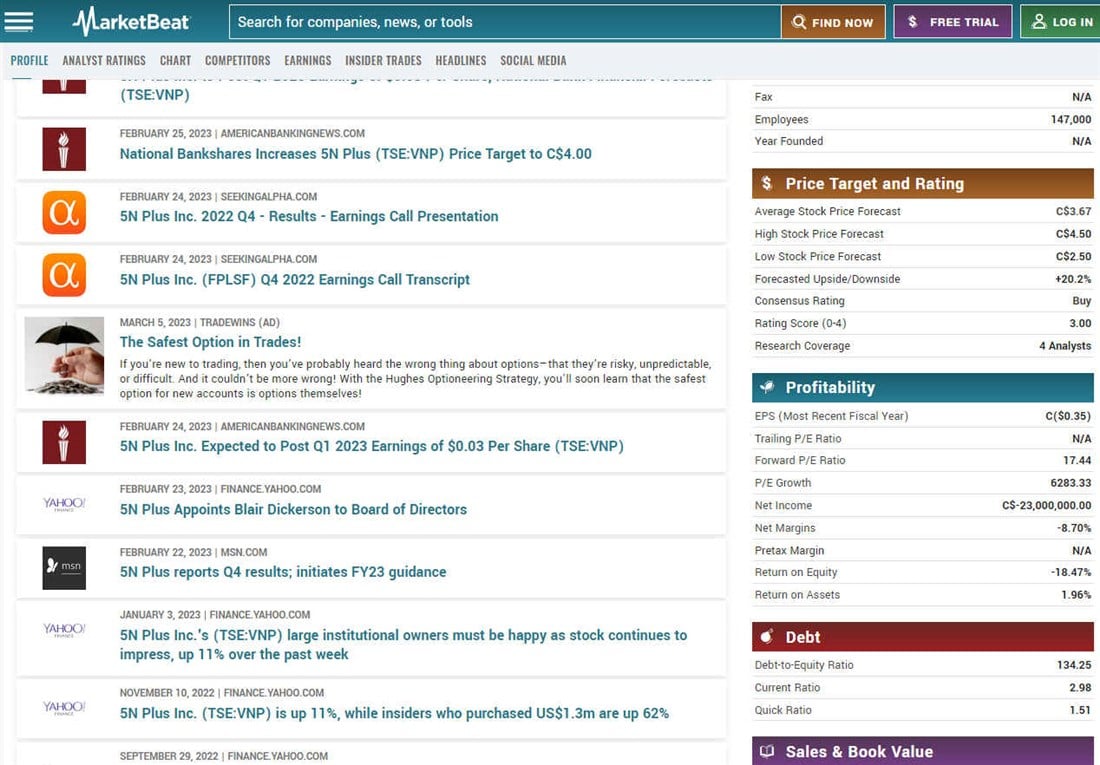
The "VNP stock news headlines" portion provides many research reports, articles, and analyses on VNP stock. The company appears profitable, trading at 17.44 times earnings based on the "profitability" details on the right side of the page scrolling down. Interestingly, the company has $1.28 cash per share indicated under the "sales and book value" section, which makes for a compelling valuation play. You can further research its products and services on its homepage, 5nplus.com

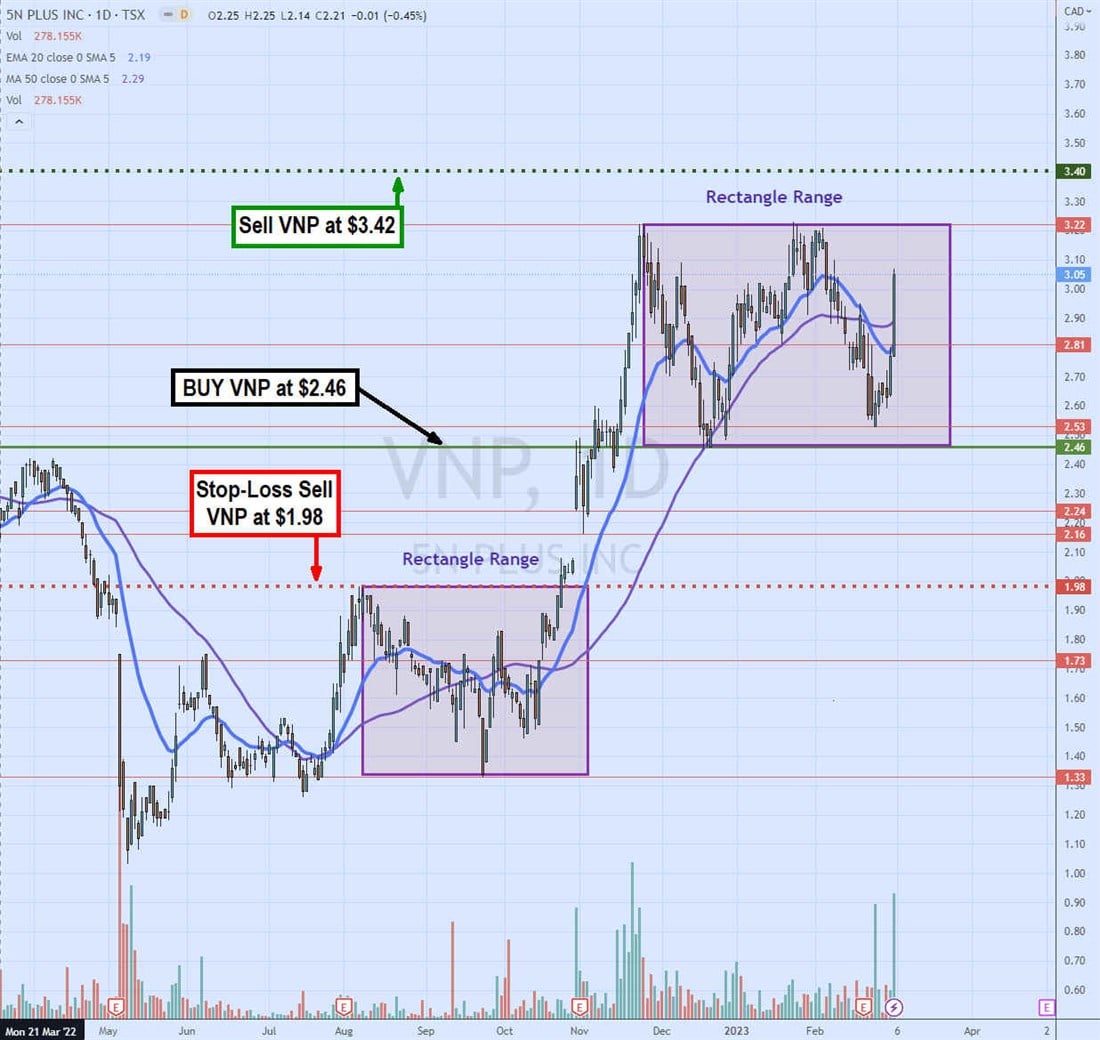
Technical analysis requires interpreting the stock's price action and history, and you can do this on a candlestick chart. Try to describe the price action as follows. The daily candlestick chart on VNP shows two rectangles (purple). The first one has a trading range between a low of $1.33 to a high of $1.98. The second rectangle has a range from $2.46 to $3.22. The 20-period exponential moving average (EMA) support is $2.81 (blue). 

We can use the lower range price of the second rectangle at $2.46 to buy. We can place a stop-loss at the top of the first rectangle at $1.98. This gives us a (48 cents) stop-loss or a (19.5%) stop-loss. If our goal is two times the risk ($0.48 x 2) for reward, our upside profit price target would be $3.42. 

The plan is to buy at $2.46 on a pullback, sell part or all at a $3.42 profit target, or take a stop-loss if the stock falls and sell at $1.98.

Where to Trade Canadian Penny Stocks

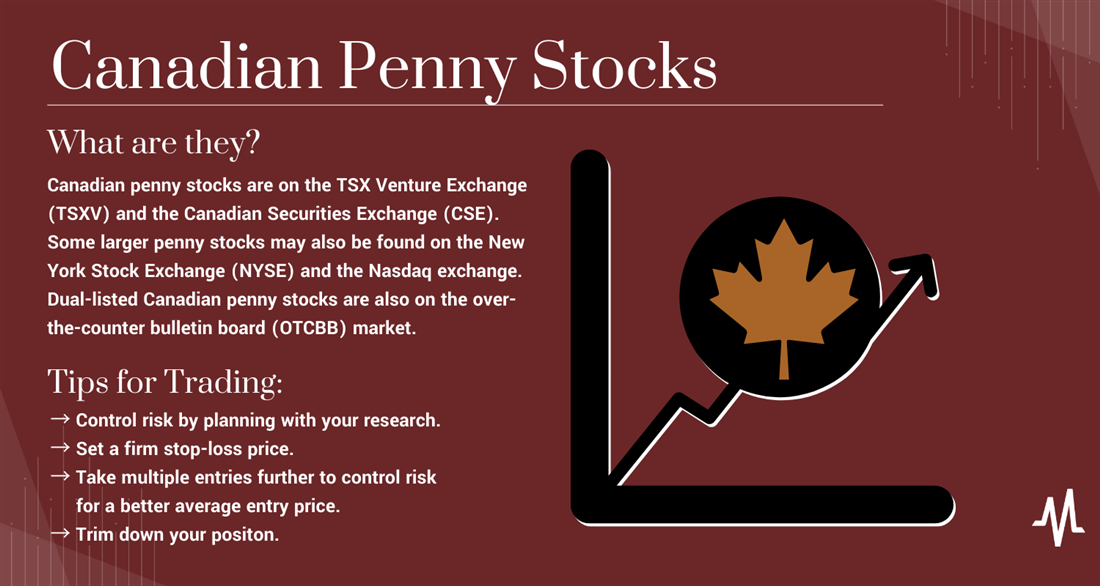
Canadian penny stocks are on the TSX Venture Exchange (TSXV) and the Canadian Securities Exchange (CSE). You may also find larger penny stocks on the New York Stock Exchange (NYSE) and the Nasdaq exchange. Dual-listed Canadian penny stocks are also on the over-the-counter bulletin board (OTCBB) market.  

Tips for Managing Penny Stock Risk 

Control risk by planning with your research, preparing, and setting a firm stop-loss price. This price can be based on a maximum percentage of the loss you will take based on your entry price or a previous support price level. You can take multiple entries further to control risk for a better average entry price. Trimming down your position is the most critical way to reduce the risk until you are back in cash and zero risk.  

Risk what you can afford to lose. Penny stocks are hazardous. You should be ready and willing to lose your investment if you decide to play altogether. Take the money you would invest in penny stocks and set it on fire. If you are comfortable with that, then you're ready to proceed. However, there's a saying that everyone has a game plan until they get punched in the face. Imagining you will lose your investment and losing your investment are entirely different things. Be sure you can handle it if the investment flops.

What is the best penny stock in Canada? 

This is an entirely subjective question. The best-performing penny stock in Canada depends on the time frame, whether daily, monthly or yearly. You can get a list of Canadian stocks hitting 52-week highs.

Can you make money with penny stocks in Canada?

Yes, you can make money with penny stocks in Canada, but you can also lose money more often than not. The real question is, how much money are you willing to lose to make money? A common justification would be a one-to-two risk-to-reward ratio meaning you're willing to risk 50 cents to make $1.

Are there penny stocks on the TSX?

There are penny stocks on the TSX based on stocks trading at $5 or less. The majority of Canadian penny stocks are on the TSXV and CSE.