At the very least, it brings more interest and eyeballs to the stock. When volume surges, there could be an opportunity. This article will explore what unusual volume means and how to find stocks with unusual volume. We'll also cover the pitfalls to avoid when trading unusual volume stocks.
Learn the different types of catalysts that can generate unusual volume so you can get familiarized with and prepared for when you encounter them.
Understanding Unusual Volume
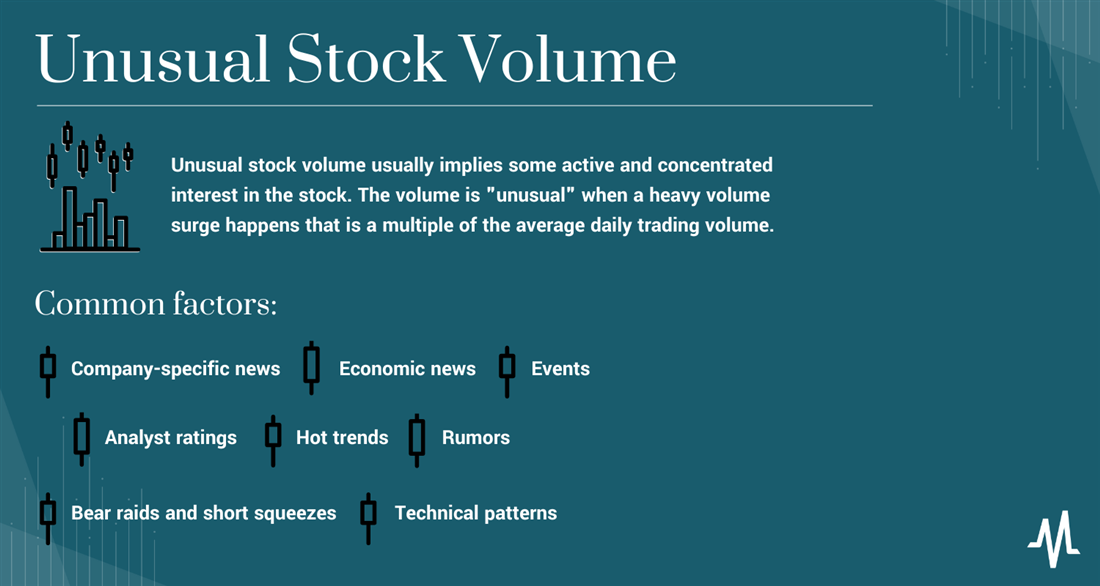
Unusual stock volume usually implies some active and concentrated interest in the stock. Actions speak louder than words, and this statement is never truer than when it comes to heavy volume surges in a stock. That action is trades and lots of them. A stock may have interest, but heavy volume proves active interest. Unusual volume usually pertains to stocks experiencing a surge in trading volume resulting in a rapid price rise or price collapse.
The volume is "unusual" when a heavy volume surge happens that is a multiple of the average daily trading volume. Eventually, the reason for the big surge in volume gets discovered and spreads as the news gets distributed. You can usually detect heavy volume on stock screeners and possibly on business news networks and blogs. This is how unusual volume turns into an even heavier volume price move.
Why Does Trading Volume Change?
Many catalysts can cause the trading volume to change. Factors range from general market-moving news and events to company-specific news. Some common factors can cause unusual volume, driving stock prices higher or lower:
- Company-specific news: Material news from a company through an SEC filing or a press release can trigger robust and unusual volume spikes. Quarterly earnings reports and earnings guidance almost always cause the volume to change dramatically.
- Economic news: Economic news events like GDP reports and interest rate changes can cause volume to surge. Government-issued economic reports like the consumer price index (CPI) can trigger strong, unusual stock volumes. Retail sales reports can impact the retail industry stocks. Home sales and new home start reports can impact homebuilder stocks.
- Events: Scheduled and unscheduled events like a product launch or a developers' conference can cause volume to surge, especially if something unexpected occurs.
- Analyst ratings: When analysts upgrade or downgrade a stock, it can change the sentiment and cause a volume swell in a stock. Large analyst firms and brokerages have a more significant impact than smaller boutique firms.
- Hot trend: When a hot theme, segment or industry has much positive sentiment, it can cause unusual volume for stocks in sympathy. The metaverse rush, cloud computing and the artificial intelligence (AI) wave in 2023 caused many stocks to surge in sympathy with the AI trends.
- Rumors: The possibility of a buyout or merger is a common rumor that can cause unusual volume. Rumors can be positive or negative and spawn heavy volume in either case.
- Bear raids and short squeezes: It's not uncommon for a stock to get unusual volume as prices sink as a reaction to a bearish report or blog. Short seller firms have been brazen in issuing press releases and reports meant to cause panic selling stocks they have short positions in. However, stocks can also surge higher on extremely heavy volumes due to a short squeeze. This was a common theme during the meme stock mania of 2021.
- Technical patterns: Sometimes a stock forms a strong technical pattern forming a breakout on no news but a strong chart pattern. Some of the most effective chart pattern breakouts can trigger volume surges as a breakout forms and accelerates.
What is Average Daily Trading Volume?
We must establish a baseline to distinguish between unusually heavy and normal trading volumes. That's where the average daily trading volume comes into play. It tells us the "normal" volume for stock and helps us identify when the extraordinary volume is present when a multiple of the normal volume emerges.
The average daily trading volume is calculated by adding the total trading volume per day for a specific number of days and dividing that figure by the name of days. Once you have the average daily trading volume, you can use that as a baseline to determine when the unusual stock volume occurs. It provides insights into the liquidity of the underlying stock. As average daily volume trends higher, more liquidity comes into the stock.
What is Considered Unusual Volume?
Stocks that trade a multiple of their average daily trading volume are considered to be experiencing unusual volume. There are levels of magnitude when it comes to unusual volume. A stock trading at 50 times average daily trading volume is more unusual than a stock trading at just three times average daily trading volume. It's important to find the catalyst for the volume surge to understand why the unusual volume is occurring.
What Stocks Trade at the Highest Volume?
Large-cap, blue chip stocks are the most widely traded and consistently have the highest volume, especially if they are components of various benchmark indexes. There are always cases where penny stocks with unusual volume may surpass blue chips on any single day, but the volume always returns to its baseline eventually.
Why Do Traders Use Average Daily Trading Volume?
The average daily trading volume is used as a baseline context to determine when there is unusual volume. There are more uses for using the average daily trading volume as an indicator. Traders like to use it as a measure of liquidity. This enables traders to buy and sell the stock without impacting the price. Trading volume is a truth serum. High trading volume helps to confirm the strength and legitimacy of a price trend.
Example of Unusual Volume
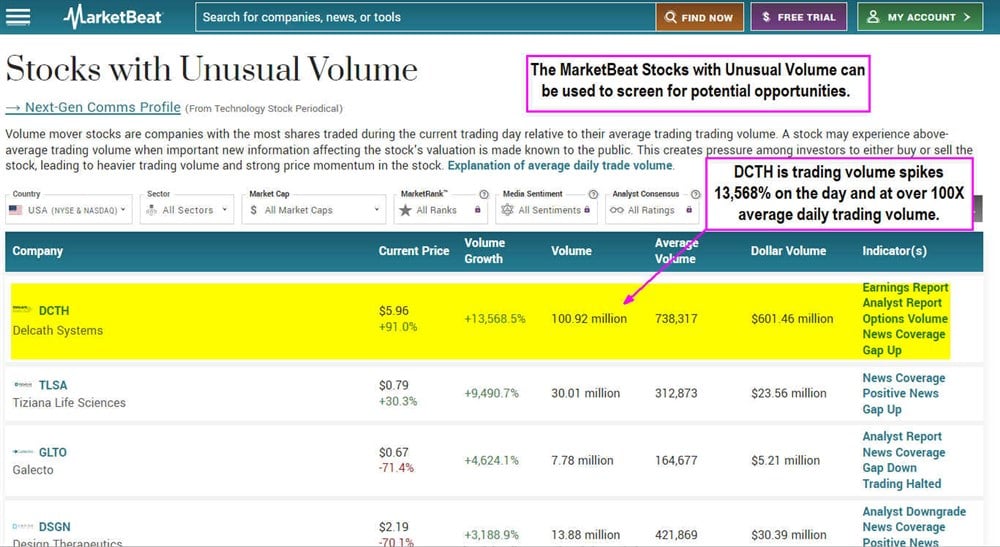
You can use the MarketBeat screener to find stocks with unusual volume today. The leading unusual volume stock happens to be trading up 91% on the day, Delcath Systems Inc. (NASDAQ: DCTH), an oncology healthcare equipment maker. The MarketBeat screener also provides the various indicators that could be a factor causing over 100X the average volume as trading volume rises 13,568%.
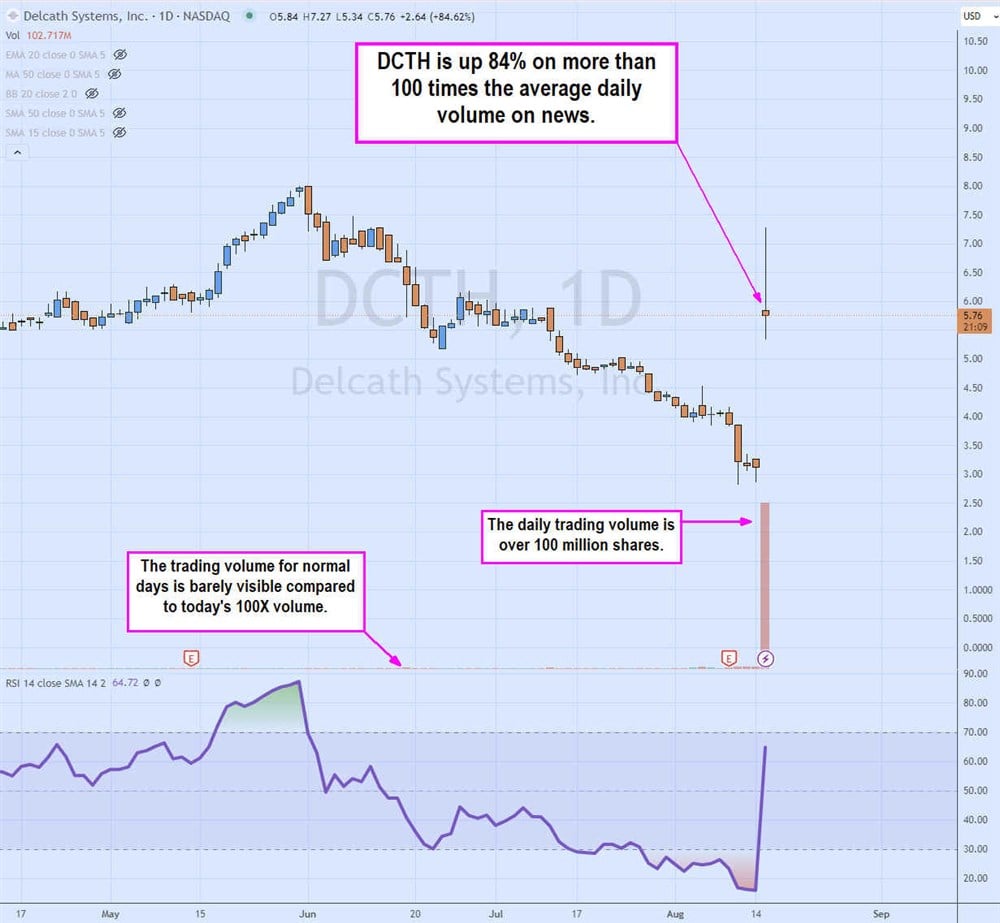
The candlestick chart with volume bars illustrates the dramatic explosion in trading volume today compared to normal days, where volume is virtually non-existent on the chart. The main catalyst was news of an FDA approval for its Hepzato Kit device for treating liver-dominant eye cancer. Hepzato delivers chemotherapy to the liver for adults with uveal melanoma, a cancer affecting the eye's melanocytes. FDA approvals are a key catalyst for unusually high volume spikes and price appreciation.
How to Find Unusual Volume Stocks in Real Time
Now that you know the answer to, "What is unusual volume?" and how it can affect stocks, it’s time to learn how to find stocks with unusual volume. Here are the four steps to finding unusual volume stocks.
Step 1: Use a stock screener.
It's hard to find stocks with unusual volumes manually. You will usually find them on a list or using an unusual volume scanner. To find a stock with unusual volume, go to MarketBeat and use the stocks with unusual volume screener tool (scroll up on this page). As it throws out a list of stocks with unusual volume, you will want to narrow your search.
Step 2: Select the stock(s) with high volume growth.
You can filter or select your stocks by various metrics depending on your screener. Some unusual volume scanners will report stocks trading at a XX multiple of the average daily trading volume.
Some screeners will present the data as volume growth, placing a percentage on the increased volume from its average daily trading volume. Once you get your list, you can arrange the list by various criteria like stocks by volume, alphabetical, or price and dollar volume. There are also standalone high relative volume stock screeners to which you can pay a subscription for real-time stocks' unusual volume. The NASDAQ website also lists NASDAQ unusual volume lists anyone can access throughout the day.
Step 3: Find the catalyst for the stock's unusual volume.
Try to find the reason for the unusual volume. You can look up the stock on MarketBeat and check the news feed or any other news source. Make sure to have multiple news sites available in case it hasn't reached mainstream sites. You can also use social media to check using the stock symbol as the search keyword. Rumors will be tough to find other than on social media. FDA approval news is more widely available and prone to generating unusual volume to the upside. Check the float and short interest to determine if a short squeeze is possible.
Step 4: Analyze the charts.
Check the stock charts to see if there was a price rise or a price reversal in the news. Frequently, if a stock price rises into material news or an event, it can trigger a sell-the-news reaction after the announcement. This is why analyzing the stock price action preceding and leading up to the catalyst is important. Once you analyze the stock technically, you can decide whether to plan your trade or move on.
Limitations of Tracking Volume Spikes
Tracking unusual volumes, like volume spikes, can have many limitations. It's important to follow the four steps thoroughly to avoid pitfalls.
Volume spikes can be misleading if it's only for a few periods. It can vastly skew the daily average trading volume. For example, if a stock only does 100,000 shares a day in volume for 10 days and then suddenly has a 50 million share trading day, it skews the average daily trading volume to 5.9 million, up from just 100,000 shares a day. This is misleading. Therefore, the fourth step to analyzing the charts is crucial. Observe the volume bars before and after the volume spikes and be aware of a potentially misleading average daily volume amount. Smooth it out with longer periods, like 200 days of history instead of 30 days.
Plan Ahead to Avoid FOMO
It's human nature to get excited about the unusual volume that leads to a massive price spike and impulsively jump in to get a piece of the action. This is called fear of missing out (FOMO).
FOMO triggers that impulse to chase stocks higher under the assumption or fear it will go much higher without you. Unfortunately, that's when the peak may be nearing. Remember that “smart” money is already taking positions before volume surges happen. By the time the volume spikes and appears on stock screeners making headlines, the action may have already peaked or is coming back down. It can be a game of musical chairs. When the news is out, traders try to sell into the momentum. Therefore, it pays to plan and analyze the stock thoroughly on stock charts to patiently wait for pullbacks to enter rather than chase the highs.
