When a stock price rises rapidly during the day, some news catalyst usually drives the share higher. Buying pressures cause stock prices to rise when demand outstrips supply. The price rise can get extreme at times as prices may rise parabolically.
While the news may be responsible for the move, it may be magnified by a short squeeze. Short sellers may be forced to cover their positions by buying too close, which propels shares higher in the process. A good indicator of the short squeeze potential for any stock is its short interest. What is short interest? In this article, we will review what you need to know about short interest and how to track it and use it for trading and investing.
Overview of Short Interest
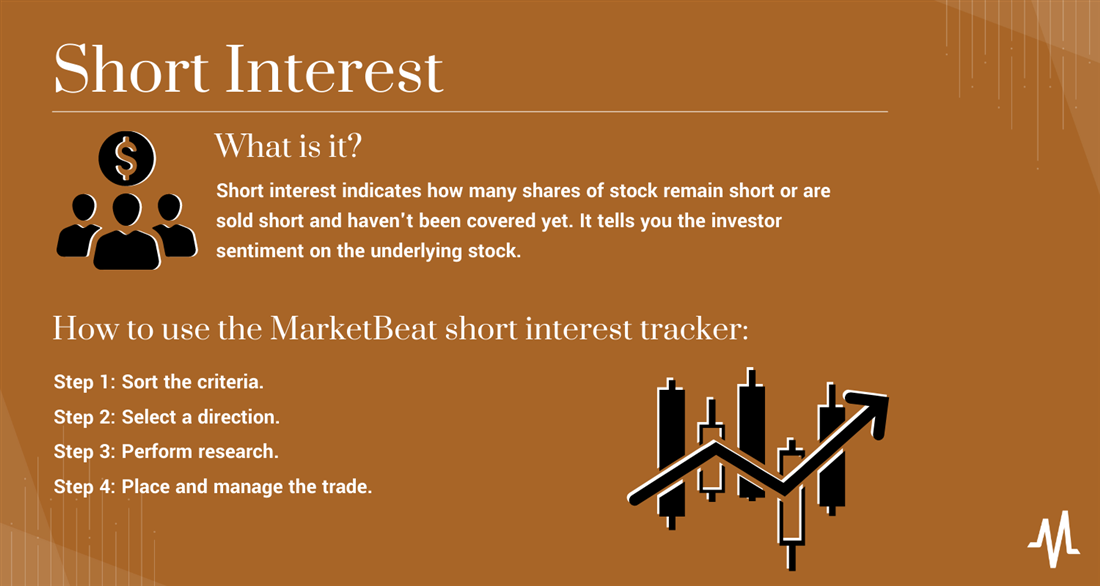
Short interest indicates how many shares of stock remain short or are sold short and haven't been covered yet. It's important to know what it means to short sell a stock. Typically, investors tend to buy stocks taking a long position. You can profit if the stock price rises above your entry price. You lose money if the stock price falls below your entry price. You lock in and cash in your profits by selling your long position. This naturally causes some selling pressure. If too many people sell the stock, the price can fall lower.
When you short a stock, you are selling it first, hoping for the price to fall so you can repurchase it at a lower price. The stock must be shortable, and then the shares are borrowed from the broker, who goes through a clearinghouse and lends it to you. Remember that not all stocks are shortable.
To return to the broker, you borrow shares to sell and repurchase them, preferably at a lower price. The lower the price falls below your sell price, the more profits you can make. You cover the short to lock in your profits, which means buying back the stock. Covering a short position causes buying pressure. If too many short sellers cover simultaneously, the buying pressure can cause shares to rise rapidly, triggering a short squeeze.
A short squeeze is a real phenomenon where a stock's price rises sharply on heavy volume, forcing other short sellers to cover their short position to avoid further losses. Buying to cover perpetuates the price rise as more short sellers cover their position in a panic as the price continues to rise from the buying pressure. Short squeezes trigger when unexpected favorable news, rumors or events make the news wires. They can build up and accelerate as the stock price rises. A high short interest indicates a bearish investor sentiment in the stock.
The odds of a short squeeze are higher for stocks with the highest short interest. Consumer discretionary stocks tend to have a higher short interest than consumer staples stocks. A high short interest can trigger a short squeeze which would cause the underlying price to move to rise faster and higher than if it had a low short interest. The rule of thumb is that stocks with the highest short interest have the highest probability of a short squeeze. Short interest can be listed by the number of shares that are short or a percentage of the outstanding shares or the float that are short.
Blue-chip stocks tend to have a low short interest. It's crucial to be aware of an ex-dividend date if shorting a dividend stock because you will have to pay the dividend if you do. Yes, the dividend payment comes out of your pocket if you hold a short position on a dividend stock through its ex-dividend date. This is very important for traders who think they can get easy short-selling profits since dividend stocks gap down the dividend amount on the ex-dividend date. Blue-chip stocks with a dividend tend to have some of the lowest short interest in the market.
Why Do Investors Short Sell?
What would compel someone to expect a stock price to fall? That's the real question when asking why investors and traders short sell a stock. There are many reasons to sell a stock short, but truly only one real motive for doing it. To make money off the stock price falling lower and profit from the price decline. The reasons for shorting a stock can range from bad news like a weak earnings report or lowered guidance or losing court cases, or analyst downgrading to accounting irregularities and short-seller reports.
The other motive could be to hedge a long position of a like stock or company. Most brokers don't allow you to go long and short the same stock in your account. This is called shorting the box. However, you can consider shorting a similar stock to your long position or a benchmark index, depending on how well it's correlated with them. If you have more than one broker, consider hedging a long position in one account with a short position of the same stock in another.
What Does Short Interest Signal?
Investors lean toward a price decline as more shares get short for various reasons. A rising short interest, or a high short interest, reflects a bearish sentiment for the underlying stock. As short interest grows, the risk of a short squeeze also grows. Typically, stocks with a high short interest have a negative sentiment that depresses share prices.
Often, stocks with high short interest have fundamental problems like falling sales, falling profits, falling margins, accounting irregularities and potential fraud. A stock that rises too fast may invite short sellers who feel the price rise isn't justified or is artificial and expect the stock price to come back down.
How to Use Short Interest
You can use short interest in many ways. A high short interest implies a bearish or negative sentiment in the stock. The high short interest may result in a higher extended price due to the short sellers being forced to cover. You can consider joining in on the short if shares are borrowable. Conversely, consider trading the long position when favorable news hits the wires.
Short interest helps you gauge the market sentiment for a particular stock. The bearish sentiment can depress stock prices in the longer term, while short squeezes can happen soon. You may want to avoid high short interest stocks in your long-term portfolio.
Example of a High Short Interest Stock
Many investors consider a short interest of 10% of the float or higher to be a high short interest. Most investors will agree that a 20% or higher short interest is considered a high short interest. Here is an example of a stock with a high short interest.
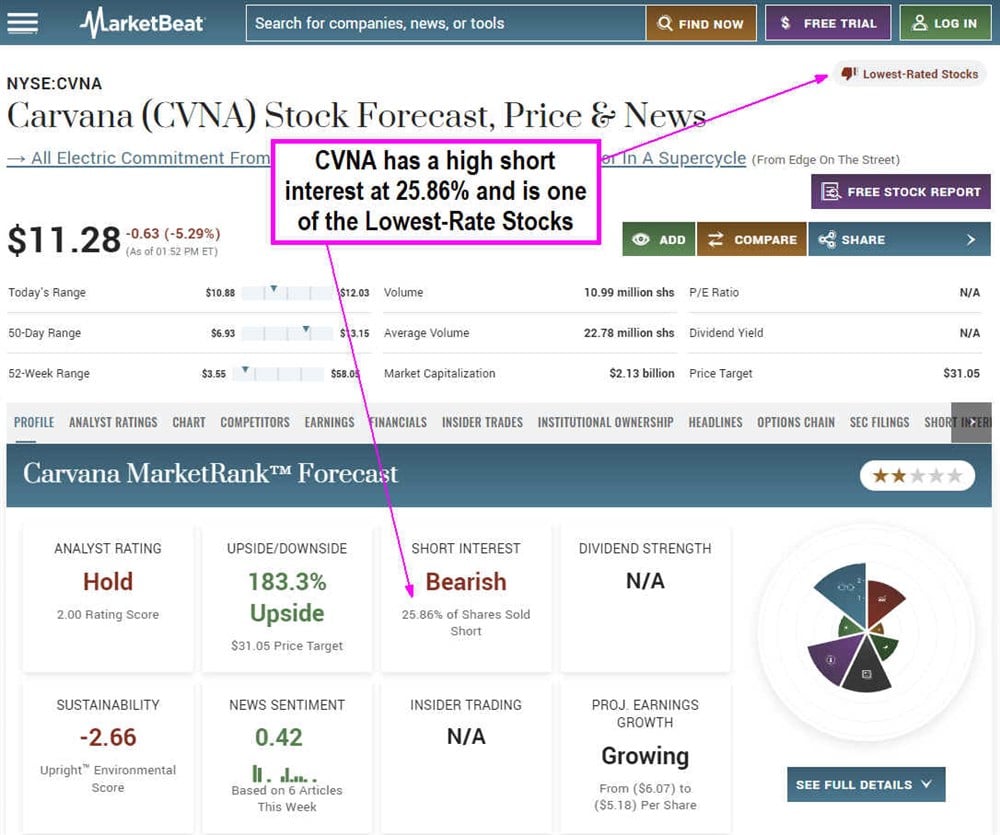
Carvana Co. (NYSE: CVNA) is a nationwide vending machine user car dealer. It enables car buyers to shop, trade for cars and pick up their purchases at over 30 vending machine locations in the U.S. The concept and potential seemed incredible in the pandemic reopening as shares skyrocketed to $376.83 on a short squeeze in August 2021. However, the reality proved otherwise as revenues sank and losses grew, sending shares down on bankruptcy fears to a low of $3.55 in December 2022.
Shares were able to rally from the lows to a high of $19.87 in February 2023 on a short squeeze. The 25.86% short interest caused the bounces to move in double-digit percentages on a short squeeze, keeping the bears on their toes.
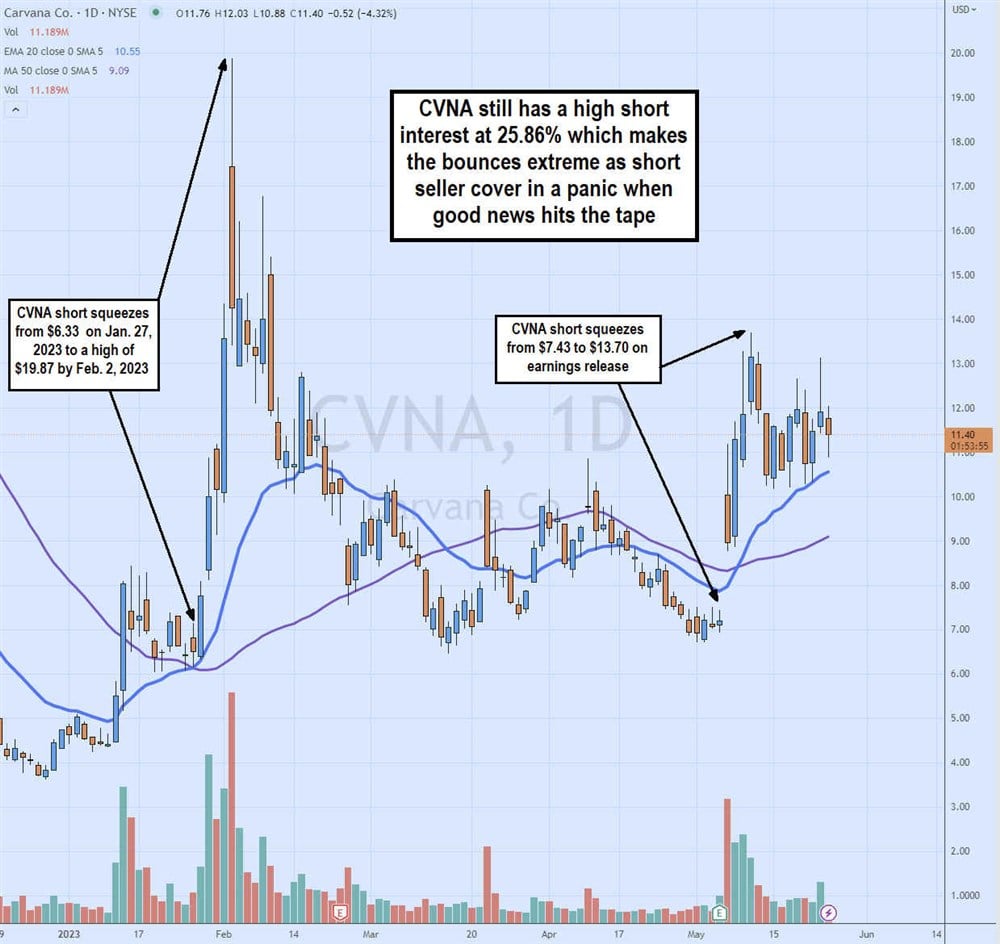
CVNA shares short squeezed over 300%, rising from 6.33 on Jan. 27 to $19.87 on Feb. 2. However, the bearish sentiment caused shares to fall back to a mid-$6 by mid-March. CVNA shares triggered another short squeeze from $7.43 to a high of $13.70 in reaction to its earnings report on May 4. The high short interest in this stock has triggered extensive upside price spikes but reversions set in after the volume normalizes.
How to Use the MarketBeat Short Interest Tracker
Look at how to use the MarketBeat Short Interest Tracker below.
Step 1: Sort the criteria.
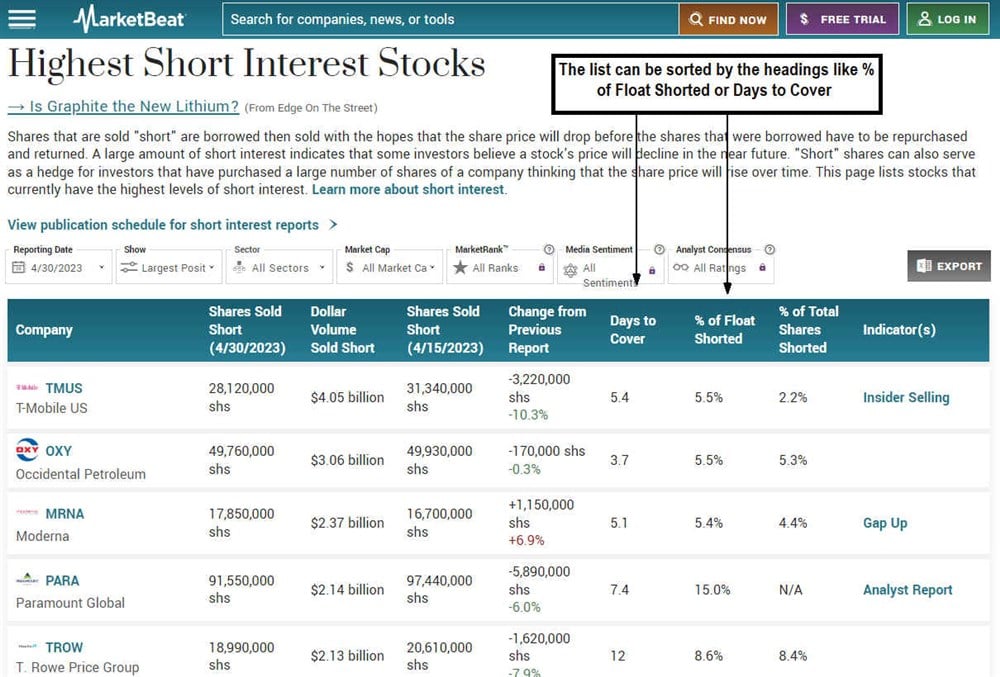
Use the MarketBeat Highest Short Interest tool and select the criteria to sort the list. You can find the stocks with the highest short interest on MarketBeat. The list identifies the highest short-interest stocks. The list is sorted by dollar volume sold short, but can also be sorted by "shares sold short," "change from the previous report," "days to cover," "percentage of float shorted" and "percentage of total shares shorted." Just click the specific heading to rearrange the list by that heading. You can check for any news with sizeable short-interest stocks.
Step 2: Select a direction.
After you select the stocks to trade:
- Determine the direction.
- If you plan to make a trade, decide whether you want to consider a long or short position.
- Be careful not to assume that a high short interest will result in a squeeze.
Stocks have a high short interest for a reason, and enough participants are skeptical enough to warrant putting their money where their mouth is with shares sold short. Don't assume that companies with high short interest will automatically trigger a short squeeze.
Do your fundamental research on the company operations by reading the recent 10-K, conference call transcripts, press release and analyst reports. Do technical analysis with charts to determine the price trend, support and resistance levels. These are levels for entry and exit. Plan your trade using these levels for entry, profit and stop losses.
Step 4: Place and manage the trade.
Stick to your trading plan. Place your limit order(s) for entry either on the long or the short side. If shorting, confirm borrowable shares and note the maintenance margin requirement. It's crucial to keep a stop loss when shorting a stock to avoid more minor losses turning into massive losses that could blow out your account. Execute the trade and continue to monitor and manage it. Be sure to take your exits as price levels are high, either on the upside or the downside.
What is a Short Squeeze?
A short squeeze is a phenomenon where a stock's price spikes sharply, rapidly and extensively, forcing short sellers to buy shares to cover their positions to avoid more significant losses. As share prices rise, the value of their short position may rise beyond the margin limits. This can trigger a margin call, which requires the trader to deposit more capital into the account or buy back shares to cover some or all of the short positions and take the losses. All short selling is done with a margin account. You can only borrow shares in a margin account.
If a stock squeezes high enough, like squeezing up over 100% in an hour, it can trigger a forced liquidation, a margin call that automatically covers the short position at market prices. This means the broker will automatically repurchase the shares using market orders to cut the losses in the account. Market buy orders can result in expensive buy covers during a short squeeze. Forced liquidations can happen automatically without warning. For this reason, it's very critical to be aware of the maintenance margin requirements on any stock you are short. Brokers can adjust the maintenance margin abruptly during the day, so stay on top.
Risks of Short Selling
The most significant risk of short selling is the unlimited loss potential of a short position that goes against you. With long positions, you can only lose the amount you bought in the stock. If you buy at $32, you can only lose ($32) per share if it goes to zero, theoretically. However, if you short sell a stock at $32, it can keep rising and mounting up unlimited losses. A great example is video game retailer GameStop Corp. (NYSE: GME). The stock short squeezed from $4.75 on Jan. 11, 2021, to a high of $120.75 (split adjusted) on Jan. 25, 2021. GME had a short interest of 140%, which implies a large percentage of illegal naked shorts. Naked shorts happen when a stock is shorted without actually borrowing the shares.
GME kicked off the "meme stock" mania triggering short squeezes on various other stocks with high short interests like AMC Entertainment Inc. (NYSE: AMC), which rallied from $5.87 to $44.61 (split adjusted) in two weeks.
Don't Rely Solely on Short Interest Alone
The meme stock mania of 2021 instilled the belief that all stocks with a high short interest were destined to short squeeze higher. However, the meme stock mania transformed into the meme stock bubble as almost every high short interest stock that rallied to highs in 2021 eventually sold off back down to the lows by mid-to-late 2022. The moral of this cautionary tale is not to rely solely on a high short interest to go long, expecting a short squeeze to propel the stock higher. Stocks with a high short interest often fall lower after periods of a short squeeze.
FAQs
Here are answers to some frequently asked questions about "What is short interest in stocks?"
What does short interest tell you?
Short interest tells you the investor sentiment on the underlying stock. A high short interest above 20% indicates investors are bearish, while a low short interest under 5% indicates bullish investor sentiment. If you can spot what stock has the highest short interest, you may witness a short squeeze on favorable news.
Is low short interest good or bad?
Low short interest indicates a bullish sentiment for the underlying stock. It indicates the absence of bears compared to bulls. As an investor, low short interest is a good sign and indicator of bullishness in the stock.
What is short vs. long interest?
Short interest indicates the level of bearishness in the stock. There isn't a direct indicator called long interest in a stock. However, you can do the math and subtract short interest from the total float, percentage of the float or outstanding shares to determine the long interest. For example, if the short interest is 25%, then one can assume the long interest is 75%.
