Go Pro

Finance Stocks List

This page shows information about the 50 largest finance sector stocks including Berkshire Hathaway, Berkshire Hathaway, JPMorgan Chase & Co. and Bank of America.

Berkshire Hathaway stock logo

1. Berkshire Hathaway NYSE:BRK.B

$489.30 -1.95 (-0.40%)
Closing price 03:59 PM Eastern
Extended Trading
$489.31 +0.01 (+0.00%)
As of 08:00 PM Eastern
Extended trading is trading that happens on electronic markets outside of regular trading hours. This is a fair market value extended hours price provided by Massive. Learn more.

Berkshire Hathaway Inc, through its subsidiaries, engages in the insurance, freight rail transportation, and utility businesses worldwide. More about Berkshire Hathaway

Pros of Berkshire Hathaway

  • Berkshire Hathaway has a strong commitment to the energy sector, recently increasing its position in Chevron, which indicates confidence in dividend-paying stocks and potential for future growth.
  • The company maintains a record cash position, allowing it to capitalize on buying opportunities during market corrections, which is a strategic advantage for long-term investors.
  • The current stock price is around $720, reflecting the company's robust performance and stability in a volatile market.

Cons of Berkshire Hathaway

  • Despite its strong cash reserves, Berkshire Hathaway's significant investments in underperforming sectors, such as oil, may pose risks if market conditions do not improve.
  • The company's heavy reliance on its insurance and utility businesses could limit growth potential compared to more dynamic sectors.
  • Recent market trends show that Berkshire Hathaway's stock has lagged behind the S&P 500, raising concerns about its competitive edge.
A.I. GeneratedThese insights were generated using artificial intelligence. They are based on proprietary MarketBeat data, news articles, and custom LLM A.I. algorithms.
Market Capitalization
$1.06 trillion
P/E Ratio
14.57
Consensus Rating
Hold
Consensus Price Target
$524.50 (+7.2% Upside)
Volume
4.46 million shares
Average Volume
4.36 million shares
Today's Range
$487.38
$491.20
50-Day Range
$469.95
$506.85
52-Week Range
$455.18
$516.85
Dividend Yield
N/A
Berkshire Hathaway stock logo

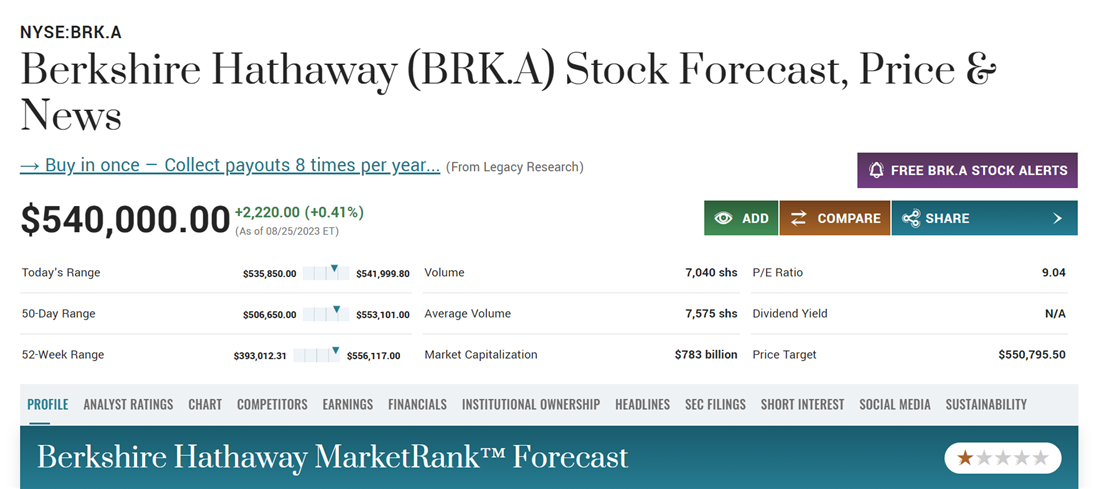
2. Berkshire Hathaway NYSE:BRK.A

$734,250.66 -1,949.34 (-0.26%)
Closing price 03:59 PM Eastern
Extended Trading
$734,260.21 +9.55 (+0.00%)
As of 07:39 PM Eastern
Extended trading is trading that happens on electronic markets outside of regular trading hours. This is a fair market value extended hours price provided by Massive. Learn more.

Berkshire Hathaway Inc, through its subsidiaries, engages in the insurance, freight rail transportation, and utility businesses worldwide. More about Berkshire Hathaway

Pros of Berkshire Hathaway

  • The current stock price is around $720, reflecting strong market confidence in the company's diversified business model.
  • Berkshire Hathaway has a robust portfolio of subsidiaries across various industries, including insurance, utilities, and manufacturing, which helps mitigate risks associated with market volatility.
  • The company has consistently demonstrated strong financial performance, with significant revenue growth driven by its insurance and utility sectors.

Cons of Berkshire Hathaway

  • The company's size and complexity can lead to slower decision-making processes, potentially hindering its ability to adapt quickly to market changes.
  • Recent fluctuations in the stock market may impact Berkshire Hathaway's stock performance, leading to uncertainty for investors.
  • As a conglomerate, Berkshire Hathaway's diverse operations can sometimes dilute focus, making it challenging to maintain competitive advantages in specific sectors.
A.I. GeneratedThese insights were generated using artificial intelligence. They are based on proprietary MarketBeat data, news articles, and custom LLM A.I. algorithms.
Market Capitalization
$1.06 trillion
P/E Ratio
14.57
Consensus Rating
Hold
Consensus Price Target
$758,532.00 (+3.3% Upside)
Volume
150 shares
Average Volume
183 shares
Today's Range
$731,138.00
$736,562.88
50-Day Range
$705,160.56
$760,590.00
52-Week Range
$685,150.00
$775,000.00
Dividend Yield
N/A
JPMorgan Chase & Co. stock logo

3. JPMorgan Chase & Co. NYSE:JPM

$344.74 +5.87 (+1.73%)
Closing price 03:59 PM Eastern
Extended Trading
$345.14 +0.40 (+0.11%)
As of 07:59 PM Eastern
Extended trading is trading that happens on electronic markets outside of regular trading hours. This is a fair market value extended hours price provided by Massive. Learn more.

JPMorgan Chase & Co is a financial holding company, which engages in the provision of financial and investment banking services. More about JPMorgan Chase & Co.

Pros of JPMorgan Chase & Co.

  • The current stock price is around $150, reflecting strong market confidence in the company's performance.
  • JP Morgan Chase has a low payout ratio of 25.71%, indicating that the company retains a significant portion of its earnings for reinvestment, which can lead to future growth.
  • The firm operates across diverse financial services, including retail banking, investment banking, and asset management, which helps mitigate risks associated with economic fluctuations.

Cons of JPMorgan Chase & Co.

  • Increased competition in the financial services sector may pressure profit margins, as new entrants and fintech companies continue to innovate.
  • Economic uncertainties, including potential recessions or market volatility, could adversely affect the bank's performance and stock price.
  • Regulatory challenges and compliance costs are ongoing concerns that can impact profitability and operational efficiency.
A.I. GeneratedThese insights were generated using artificial intelligence. They are based on proprietary MarketBeat data, news articles, and custom LLM A.I. algorithms.
Market Capitalization
$908.01 billion
P/E Ratio
14.77
Consensus Rating
Moderate Buy
Consensus Price Target
$356.38 (+3.4% Upside)
Volume
5.73 million shares
Average Volume
10.04 million shares
Today's Range
$337.30
$345.74
50-Day Range
$295.67
$346.77
52-Week Range
$279.10
$351.24
Dividend Yield
1.77%
Bank of America stock logo

4. Bank of America NYSE:BAC

$61.12 +0.70 (+1.15%)
Closing price 03:59 PM Eastern
Extended Trading
$61.22 +0.10 (+0.16%)
As of 07:59 PM Eastern
Extended trading is trading that happens on electronic markets outside of regular trading hours. This is a fair market value extended hours price provided by Massive. Learn more.

Bank of America Corporation, through its subsidiaries, provides banking and financial products and services for individual consumers, small and middle-market businesses, institutional investors, large corporations, and governments worldwide. More about Bank of America

Pros of Bank of America

  • The company recently reported strong quarterly earnings, exceeding analysts' expectations, which indicates robust financial health and operational efficiency.
  • Bank of America has a solid dividend yield of approximately 1.8%, providing a steady income stream for investors through regular cash dividends.
  • Recent positive sentiment from multiple firms has led to increased earnings estimates for the upcoming years, suggesting improving profitability and growth potential.

Cons of Bank of America

  • The company reported revenue of $8.08 billion for the quarter, significantly below analysts' expectations, which raises concerns about its ability to meet future growth targets.
  • Despite a strong earnings report, the net margin and return on equity, while positive, may not be as competitive compared to other financial institutions, indicating potential limitations in profitability.
  • Insider selling activity, such as the recent sale of a significant number of shares by an insider, could signal a lack of confidence in the company's short-term performance.
A.I. GeneratedThese insights were generated using artificial intelligence. They are based on proprietary MarketBeat data, news articles, and custom LLM A.I. algorithms.
Market Capitalization
$428.78 billion
P/E Ratio
14.02
Consensus Rating
Moderate Buy
Consensus Price Target
$63.77 (+4.3% Upside)
Volume
31.63 million shares
Average Volume
32.82 million shares
Today's Range
$60.07
$61.53
50-Day Range
$49.77
$61.62
52-Week Range
$44.75
$62.12
Dividend Yield
1.85%
HSBC stock logo

5. HSBC NYSE:HSBC

$101.08 +2.07 (+2.09%)
Closing price 03:59 PM Eastern
Extended Trading
$101.57 +0.49 (+0.48%)
As of 07:59 PM Eastern
Extended trading is trading that happens on electronic markets outside of regular trading hours. This is a fair market value extended hours price provided by Massive. Learn more.

HSBC Holdings plc provides banking and financial services worldwide. The company operates through Wealth and Personal Banking, Commercial Banking, and Global Banking and Markets segments. More about HSBC

Pros of HSBC

  • The current stock price is around $92.61, which reflects a stable market position and potential for growth.
  • HSBC Holdings plc reported a strong quarterly revenue of $19.12 billion, indicating robust operational performance.
  • The company has a net margin of 16.06%, showcasing its efficiency in converting revenue into profit.

Cons of HSBC

  • Insider selling activity, such as the recent sale of over 23,000 shares by an insider, may raise concerns about the company's future prospects.
  • Only 1.48% of the stock is owned by institutional investors, which could indicate a lack of confidence from larger investment entities.
  • The price-to-earnings ratio of 15.97, while reasonable, may suggest that the stock is not undervalued compared to its peers.
A.I. GeneratedThese insights were generated using artificial intelligence. They are based on proprietary MarketBeat data, news articles, and custom LLM A.I. algorithms.
Market Capitalization
$340.27 billion
P/E Ratio
16.57
Consensus Rating
Hold
Consensus Price Target
N/A
Volume
1.02 million shares
Average Volume
1.23 million shares
Today's Range
$99.96
$101.65
50-Day Range
$86.29
$101.08
52-Week Range
$60.61
$101.65
Dividend Yield
1.97%
Morgan Stanley stock logo

6. Morgan Stanley NYSE:MS

$216.34 +5.40 (+2.56%)
Closing price 03:59 PM Eastern
Extended Trading
$217.00 +0.66 (+0.30%)
As of 08:00 PM Eastern
Extended trading is trading that happens on electronic markets outside of regular trading hours. This is a fair market value extended hours price provided by Massive. Learn more.

Morgan Stanley, a financial holding company, provides various financial products and services to corporations, governments, financial institutions, and individuals in the Americas, Europe, the Middle East, Africa, and Asia. More about Morgan Stanley

Pros of Morgan Stanley

  • The current stock price is around $211, reflecting a strong performance in the financial services sector.
  • The company has recently increased its quarterly dividend to $1.15, indicating a commitment to returning value to shareholders.
  • With a net margin of 15.65%, Morgan Stanley demonstrates effective cost management and profitability, which can be attractive to investors.

Cons of Morgan Stanley

  • The company has a relatively high debt-to-equity ratio of 3.52, which may indicate increased financial risk and reliance on borrowed funds.
  • With a current ratio of 0.77, Morgan Stanley may face challenges in meeting short-term liabilities, raising concerns about liquidity.
  • Despite recent growth, the price-to-earnings ratio of 17.40 suggests that the stock may be overvalued compared to its earnings, which could deter value-focused investors.
A.I. GeneratedThese insights were generated using artificial intelligence. They are based on proprietary MarketBeat data, news articles, and custom LLM A.I. algorithms.
Market Capitalization
$332.71 billion
P/E Ratio
17.49
Consensus Rating
Moderate Buy
Consensus Price Target
$224.50 (+3.8% Upside)
Volume
7.00 million shares
Average Volume
5.86 million shares
Today's Range
$212.25
$217.40
50-Day Range
$189.58
$228.52
52-Week Range
$136.17
$232.25
Dividend Yield
1.90%
The Goldman Sachs Group stock logo

7. The Goldman Sachs Group NYSE:GS

$1,084.66 +29.63 (+2.81%)
Closing price 03:59 PM Eastern
Extended Trading
$1,086.00 +1.34 (+0.12%)
As of 07:59 PM Eastern
Extended trading is trading that happens on electronic markets outside of regular trading hours. This is a fair market value extended hours price provided by Massive. Learn more.

The Goldman Sachs Group, Inc, a financial institution, provides a range of financial services for corporations, financial institutions, governments, and individuals worldwide. More about The Goldman Sachs Group

Pros of The Goldman Sachs Group

  • The current stock price is around $1,024.94, which is near its 50-day moving average, indicating potential stability in the short term.
  • The company reported a significant increase in revenue, up approximately 39.4% compared to the same quarter last year, showcasing strong growth potential.
  • With a net margin of 14.13%, The Goldman Sachs Group, Inc. demonstrates effective cost management and profitability, which can be attractive to investors.

Cons of The Goldman Sachs Group

  • The company has a high debt-to-equity ratio of 2.89, which may indicate higher financial risk and reliance on debt financing.
  • Despite recent growth, the stock has shown volatility with a beta of 1.30, suggesting it may be more sensitive to market fluctuations compared to the overall market.
  • The current quick ratio is 0.63, which is below 1, indicating potential liquidity issues that could affect the company's ability to meet short-term obligations.
A.I. GeneratedThese insights were generated using artificial intelligence. They are based on proprietary MarketBeat data, news articles, and custom LLM A.I. algorithms.
Market Capitalization
$311.24 billion
P/E Ratio
16.74
Consensus Rating
Hold
Consensus Price Target
$1,061.43 (-2.1% Downside)
Volume
1.64 million shares
Average Volume
2.01 million shares
Today's Range
$1,063.00
$1,088.48
50-Day Range
$927.61
$1,152.11
52-Week Range
$691.88
$1,153.99
Dividend Yield
1.71%
Royal Bank Of Canada stock logo

8. Royal Bank Of Canada NYSE:RY

$210.99 +0.62 (+0.29%)
Closing price 03:59 PM Eastern
Extended Trading
$212.28 +1.29 (+0.61%)
As of 07:57 PM Eastern
Extended trading is trading that happens on electronic markets outside of regular trading hours. This is a fair market value extended hours price provided by Massive. Learn more.

Royal Bank of Canada operates as a diversified financial service company worldwide. The company's Personal & Commercial Banking segment offers checking and savings accounts, home equity financing, personal lending, private banking, indirect lending, including auto financing, mutual funds and self-directed brokerage accounts, guaranteed investment certificates, credit cards, and payment products and solutions; and lending, leasing, deposit, investment, foreign exchange, cash management, auto dealer financing, trade products, and services to small and medium-sized commercial businesses. More about Royal Bank Of Canada

Pros of Royal Bank Of Canada

  • The current stock price is around $198, which reflects a strong performance compared to its 12-month high of $218.57, indicating potential for growth.
  • Royal Bank of Canada recently reported a quarterly revenue increase of 11.4% year-over-year, showcasing its ability to grow in a competitive market.
  • The company has a solid net margin of 15.92%, which suggests efficient management and profitability, making it an attractive option for investors.

Cons of Royal Bank Of Canada

  • The current ratio of 0.82 suggests that the company may face challenges in meeting its short-term liabilities, which could raise concerns about liquidity.
  • Royal Bank of Canada experienced a decline in earnings per share (EPS) from $3.12 to $2.84 in the most recent quarter, indicating potential volatility in profitability.
  • Analysts have mixed ratings on the stock, with some suggesting a "Hold" rating, which may indicate uncertainty about future performance.
A.I. GeneratedThese insights were generated using artificial intelligence. They are based on proprietary MarketBeat data, news articles, and custom LLM A.I. algorithms.
Market Capitalization
$291.70 billion
P/E Ratio
18.96
Consensus Rating
Moderate Buy
Consensus Price Target
$225.00 (+6.6% Upside)
Volume
1.71 million shares
Average Volume
1.60 million shares
Today's Range
$209.40
$211.56
50-Day Range
$179.95
$217.77
52-Week Range
$127.38
$218.57
Dividend Yield
2.24%
Wells Fargo & Company stock logo

9. Wells Fargo & Company NYSE:WFC

$87.59 +1.26 (+1.46%)
Closing price 03:59 PM Eastern
Extended Trading
$87.88 +0.29 (+0.33%)
As of 07:57 PM Eastern
Extended trading is trading that happens on electronic markets outside of regular trading hours. This is a fair market value extended hours price provided by Massive. Learn more.

Wells Fargo & Co is a diversified and community-based financial services company, which engages in the provision of banking, insurance, investments, mortgage, and consumer and commercial finance products and services. More about Wells Fargo & Company

Pros of Wells Fargo & Company

  • The company has demonstrated a solid return on equity, indicating effective management and profitability, which is appealing to investors looking for strong financial performance.
  • Wells Fargo & Company recently reported a quarterly revenue increase, showcasing growth potential and resilience in its business operations.
  • The current stock price is around $75, which may present a buying opportunity for investors looking to enter at a favorable valuation.

Cons of Wells Fargo & Company

  • The company’s recent revenue fell short of analyst estimates, which may raise concerns about its ability to meet future growth expectations.
  • Wells Fargo & Company has a debt-to-equity ratio of 1.12, indicating a higher level of debt relative to equity, which could pose risks in a rising interest rate environment.
  • The quick and current ratios are both at 0.90, suggesting potential liquidity issues, as the company may struggle to cover short-term obligations.
A.I. GeneratedThese insights were generated using artificial intelligence. They are based on proprietary MarketBeat data, news articles, and custom LLM A.I. algorithms.
Market Capitalization
$264.19 billion
P/E Ratio
12.73
Consensus Rating
Moderate Buy
Consensus Price Target
$98.50 (+12.5% Upside)
Volume
17.61 million shares
Average Volume
15.76 million shares
Today's Range
$85.89
$88.26
50-Day Range
$73.46
$87.90
52-Week Range
$72.78
$97.76
Dividend Yield
2.09%
Mitsubishi UFJ Financial Group stock logo

10. Mitsubishi UFJ Financial Group NYSE:MUFG

$22.14 +0.73 (+3.39%)
Closing price 03:59 PM Eastern
Extended Trading
$22.10 -0.04 (-0.16%)
As of 07:59 PM Eastern
Extended trading is trading that happens on electronic markets outside of regular trading hours. This is a fair market value extended hours price provided by Massive. Learn more.

Mitsubishi UFJ Financial Group, Inc operates as the bank holding company, that engages in a range of financial businesses in Japan, the United States, Europe, Asia/Oceania, and internationally. More about Mitsubishi UFJ Financial Group

Pros of Mitsubishi UFJ Financial Group

  • The current stock price is around $19.69, which is near its 50-day simple moving average, indicating potential stability in the short term.
  • Recent analyst ratings show a consensus of "Buy," with multiple analysts issuing positive ratings, suggesting confidence in the company's growth prospects.
  • Mitsubishi UFJ Financial Group, Inc. has a strong position as one of Japan's largest banking groups, providing a comprehensive suite of financial services that can attract a diverse client base.

Cons of Mitsubishi UFJ Financial Group

  • The stock has experienced fluctuations, with a 1-year low of $13.19, which may indicate volatility and potential risks for investors.
  • Despite positive ratings, there is still one analyst who has assigned a "Hold" rating, suggesting some uncertainty about the stock's immediate performance.
  • Only 13.59% of the stock is owned by institutional investors and hedge funds, which may indicate a lack of broader institutional support compared to other financial institutions.
A.I. GeneratedThese insights were generated using artificial intelligence. They are based on proprietary MarketBeat data, news articles, and custom LLM A.I. algorithms.
Market Capitalization
$254.09 billion
P/E Ratio
15.70
Consensus Rating
Moderate Buy
Consensus Price Target
N/A
Volume
2.31 million shares
Average Volume
3.13 million shares
Today's Range
$21.89
$22.21
50-Day Range
$18.46
$22.78
52-Week Range
$13.56
$22.83
Dividend Yield
2.37%
American Express stock logo

11. American Express NYSE:AXP

$351.01 -0.92 (-0.26%)
Closing price 03:59 PM Eastern
Extended Trading
$352.00 +0.99 (+0.28%)
As of 07:59 PM Eastern
Extended trading is trading that happens on electronic markets outside of regular trading hours. This is a fair market value extended hours price provided by Massive. Learn more.

American Express Company, together with its subsidiaries, operates as integrated payments company in the United States, Europe, the Middle East and Africa, the Asia Pacific, Australia, New Zealand, Latin America, Canada, the Caribbean, and Internationally. More about American Express

Pros of American Express

  • The current stock price is around $350, which may present a buying opportunity for investors looking for growth in the financial services sector.
  • American Express reported a significant year-over-year revenue increase of 11.4%, indicating strong business performance and potential for future growth.
  • The company has a robust return on equity of 33.95%, suggesting effective management and profitability, which can be attractive to investors.

Cons of American Express

  • Despite strong revenue growth, the company reported quarterly revenue that fell short of analyst expectations, which could raise concerns about future performance.
  • The debt-to-equity ratio of 1.73 indicates a higher level of debt compared to equity, which may pose risks in a rising interest rate environment.
  • Market volatility and broader economic concerns could impact consumer spending, which is crucial for American Express's revenue model.
A.I. GeneratedThese insights were generated using artificial intelligence. They are based on proprietary MarketBeat data, news articles, and custom LLM A.I. algorithms.
Market Capitalization
$240.13 billion
P/E Ratio
21.90
Consensus Rating
Moderate Buy
Consensus Price Target
$374.11 (+6.6% Upside)
Volume
2.27 million shares
Average Volume
2.97 million shares
Today's Range
$348.24
$354.87
50-Day Range
$300.90
$361.23
52-Week Range
$288.34
$387.49
Dividend Yield
1.08%
Toronto Dominion Bank stock logo

12. Toronto Dominion Bank NYSE:TD

$120.52 +0.02 (+0.02%)
Closing price 03:59 PM Eastern
Extended Trading
$120.54 +0.02 (+0.01%)
As of 07:34 PM Eastern
Extended trading is trading that happens on electronic markets outside of regular trading hours. This is a fair market value extended hours price provided by Massive. Learn more.

The Toronto-Dominion Bank, together with its subsidiaries, provides various financial products and services in Canada, the United States, and internationally. More about Toronto Dominion Bank

Pros of Toronto Dominion Bank

  • The Toronto-Dominion Bank recently increased its quarterly dividend to $1.12 per share, reflecting a commitment to returning value to shareholders and indicating strong financial health.
  • The current stock price is around $80, which may present a favorable entry point for investors looking for growth in the banking sector.
  • Analysts predict that The Toronto-Dominion Bank will post earnings per share of 6.86 for the current fiscal year, suggesting potential for profitability and growth.

Cons of Toronto Dominion Bank

  • The bank's payout ratio, while manageable, indicates that nearly half of its earnings are distributed as dividends, which could limit funds available for reinvestment in growth opportunities.
  • Despite the recent dividend increase, the yield of 3.6% may not be competitive compared to other investment opportunities in the current market environment.
  • Market volatility and economic uncertainties can impact the banking sector, potentially affecting The Toronto-Dominion Bank's performance and stock price.
A.I. GeneratedThese insights were generated using artificial intelligence. They are based on proprietary MarketBeat data, news articles, and custom LLM A.I. algorithms.
Market Capitalization
$198.69 billion
P/E Ratio
18.80
Consensus Rating
Moderate Buy
Consensus Price Target
$156.00 (+29.4% Upside)
Volume
3.31 million shares
Average Volume
3.01 million shares
Today's Range
$119.66
$121.02
50-Day Range
$106.53
$124.83
52-Week Range
$72.21
$124.87
Dividend Yield
2.62%
Banco Santander stock logo

13. Banco Santander NYSE:SAN

$13.66 +0.34 (+2.52%)
Closing price 03:59 PM Eastern
Extended Trading
$13.70 +0.05 (+0.36%)
As of 08:00 PM Eastern
Extended trading is trading that happens on electronic markets outside of regular trading hours. This is a fair market value extended hours price provided by Massive. Learn more.

Banco Santander, SA provides various financial services worldwide. The company operates through Retail Banking, Santander Corporate & Investment Banking, Wealth Management & Insurance, and PagoNxt segments. More about Banco Santander

Pros of Banco Santander

  • The current stock price is around $12.92, which is near its fifty-day moving average, indicating potential stability in the short term.
  • Banco Santander, S.A. has a strong market capitalization of approximately $200.10 billion, suggesting a solid position in the banking sector.
  • The company reported a net margin of 26.92%, reflecting efficient management and profitability, which can be attractive to investors looking for strong financial performance.

Cons of Banco Santander

  • The company missed earnings expectations recently, reporting an EPS of $0.27 compared to the consensus estimate of $0.29, which may raise concerns about its growth trajectory.
  • Banco Santander has a beta of 0.72, indicating lower volatility compared to the market, which might not appeal to investors seeking high-risk, high-reward opportunities.
  • Despite a strong market presence, the company has a price-to-earnings-growth ratio of 0.76, suggesting that growth may not be as robust as some investors would prefer.
A.I. GeneratedThese insights were generated using artificial intelligence. They are based on proprietary MarketBeat data, news articles, and custom LLM A.I. algorithms.
Market Capitalization
$195.66 billion
P/E Ratio
11.29
Consensus Rating
Moderate Buy
Consensus Price Target
N/A
Volume
7.51 million shares
Average Volume
7.89 million shares
Today's Range
$13.40
$13.71
50-Day Range
$11.73
$14.36
52-Week Range
$8.29
$14.39
Dividend Yield
1.59%
Charles Schwab stock logo

14. Charles Schwab NYSE:SCHW

$100.19 -2.35 (-2.29%)
Closing price 03:59 PM Eastern
Extended Trading
$100.22 +0.03 (+0.03%)
As of 07:59 PM Eastern
Extended trading is trading that happens on electronic markets outside of regular trading hours. This is a fair market value extended hours price provided by Massive. Learn more.

The Charles Schwab Corporation, together with its subsidiaries, operates as a savings and loan holding company that provides wealth management, securities brokerage, banking, asset management, custody, and financial advisory services in the United States and internationally. More about Charles Schwab

Pros of Charles Schwab

  • The current stock price is around $100, which is near its one-year high, indicating strong market performance.
  • The company reported a significant increase in quarterly revenue, up 15.8% compared to the same quarter last year, showcasing robust growth.
  • With a net margin of nearly 38%, The Charles Schwab Co. demonstrates effective cost management and profitability.

Cons of Charles Schwab

  • The current ratio and quick ratio are both at 0.62, indicating potential liquidity concerns, as the company may struggle to cover short-term liabilities.
  • The stock has shown volatility with a beta of 0.77, which may not appeal to risk-averse investors looking for stability.
  • Despite recent growth, the price-to-earnings (P/E) ratio of around 20.4 suggests that the stock may be overvalued compared to its earnings.
A.I. GeneratedThese insights were generated using artificial intelligence. They are based on proprietary MarketBeat data, news articles, and custom LLM A.I. algorithms.
Market Capitalization
$178.33 billion
P/E Ratio
19.88
Consensus Rating
Moderate Buy
Consensus Price Target
$118.41 (+18.2% Upside)
Volume
14.81 million shares
Average Volume
9.45 million shares
Today's Range
$99.71
$104.48
50-Day Range
$85.35
$103.02
52-Week Range
$83.96
$107.50
Dividend Yield
1.25%
Welltower stock logo

15. Welltower NYSE:WELL

$246.59 +1.75 (+0.71%)
Closing price 03:59 PM Eastern
Extended Trading
$245.98 -0.61 (-0.25%)
As of 07:49 PM Eastern
Extended trading is trading that happens on electronic markets outside of regular trading hours. This is a fair market value extended hours price provided by Massive. Learn more.

Welltower Inc (NYSE:WELL), a real estate investment trust ("REIT") and S&P 500 company headquartered in Toledo, Ohio, is driving the transformation of health care infrastructure. More about Welltower

Pros of Welltower

  • The company has shown significant revenue growth, with a year-over-year increase of over 38%, indicating strong demand for its healthcare real estate services.
  • Welltower Inc. has set its earnings per share (EPS) guidance for FY 2026 between 6.210 and 6.350, suggesting a positive outlook for profitability.
  • Analysts predict an EPS of 6.32 for the current fiscal year, reflecting confidence in the company's financial performance.

Cons of Welltower

  • The company's dividend payout ratio is currently at 146.53%, which is above 100%. This indicates that the company is paying out more in dividends than it earns, raising concerns about sustainability.
  • Despite recent revenue growth, the high payout ratio may limit the company's ability to reinvest in its operations or pay down debt, potentially affecting long-term growth.
  • Welltower Inc. operates in a highly competitive healthcare real estate market, which could impact its ability to maintain or grow its market share.
A.I. GeneratedThese insights were generated using artificial intelligence. They are based on proprietary MarketBeat data, news articles, and custom LLM A.I. algorithms.
Market Capitalization
$172.84 billion
P/E Ratio
122.07
Consensus Rating
Moderate Buy
Consensus Price Target
$234.72 (-4.8% Downside)
Volume
2.55 million shares
Average Volume
3.02 million shares
Today's Range
$242.27
$247.45
50-Day Range
$195.37
$246.59
52-Week Range
$158.24
$247.45
Dividend Yield
1.22%
BlackRock stock logo

16. BlackRock NYSE:BLK

$1,037.31 -16.80 (-1.59%)
Closing price 03:59 PM Eastern
Extended Trading
$1,037.50 +0.19 (+0.02%)
As of 07:59 PM Eastern
Extended trading is trading that happens on electronic markets outside of regular trading hours. This is a fair market value extended hours price provided by Massive. Learn more.

BlackRock, Inc is a publicly owned investment manager. The firm primarily provides its services to institutional, intermediary, and individual investors including corporate, public, union, and industry pension plans, insurance companies, third-party mutual funds, endowments, public institutions, governments, foundations, charities, sovereign wealth funds, corporations, official institutions, and banks. More about BlackRock

Pros of BlackRock

  • The business reported a significant revenue increase of over 30% year-over-year, indicating strong growth potential and effective management strategies.
  • BlackRock, Inc. has a solid dividend yield of approximately 2.1%, providing investors with a reliable income stream through dividends.
  • The current stock price is around $720, reflecting a robust market position and investor confidence in the company's future performance.

Cons of BlackRock

  • The dividend payout ratio is relatively high at approximately 54.78%, which may limit the company's ability to reinvest profits into growth opportunities.
  • Recent earnings per share were lower than the previous year's figures, which could indicate potential challenges in maintaining profitability.
  • Market volatility and economic uncertainties could impact BlackRock, Inc.'s performance, especially in its investment management services.
A.I. GeneratedThese insights were generated using artificial intelligence. They are based on proprietary MarketBeat data, news articles, and custom LLM A.I. algorithms.
Market Capitalization
$163.38 billion
P/E Ratio
24.79
Consensus Rating
Moderate Buy
Consensus Price Target
$1,304.29 (+25.7% Upside)
Volume
1.01 million shares
Average Volume
908,374 shares
Today's Range
$1,030.93
$1,062.87
50-Day Range
$950.63
$1,105.61
52-Week Range
$917.39
$1,219.94
Dividend Yield
2.17%
UBS Group stock logo

17. UBS Group NYSE:UBS

$52.35 +0.85 (+1.64%)
Closing price 03:59 PM Eastern
Extended Trading
$52.47 +0.12 (+0.23%)
As of 07:34 PM Eastern
Extended trading is trading that happens on electronic markets outside of regular trading hours. This is a fair market value extended hours price provided by Massive. Learn more.

UBS Group AG provides financial advice and solutions to private, institutional, and corporate clients worldwide. It operates through five divisions: Global Wealth Management, Personal & Corporate Banking, Asset Management, Investment Bank, and Non-core and Legacy. More about UBS Group

Pros of UBS Group

  • The current stock price is around $46.49, which is near its 50-day moving average, indicating potential stability in the short term.
  • UBS Group AG reported a strong quarterly earnings performance, with earnings per share exceeding expectations, showcasing effective management and operational efficiency.
  • The company has a solid market capitalization of approximately $153.52 billion, reflecting its significant presence and stability in the financial services sector.

Cons of UBS Group

  • The company has a debt-to-equity ratio of 1.23, suggesting a higher level of debt compared to equity, which could pose risks in times of financial stress.
  • UBS Group AG has a current ratio of 0.85, indicating that its current liabilities exceed its current assets, which may raise concerns about short-term liquidity.
  • Despite a strong earnings report, the net margin of 12.66% may not be as high as some competitors, potentially limiting profitability growth.
A.I. GeneratedThese insights were generated using artificial intelligence. They are based on proprietary MarketBeat data, news articles, and custom LLM A.I. algorithms.
Market Capitalization
$160.88 billion
P/E Ratio
18.76
Consensus Rating
Hold
Consensus Price Target
$60.30 (+15.2% Upside)
Volume
1.20 million shares
Average Volume
1.63 million shares
Today's Range
$51.99
$52.63
50-Day Range
$45.53
$55.12
52-Week Range
$35.94
$55.15
Dividend Yield
0.69%
Sumitomo Mitsui Financial Group stock logo

18. Sumitomo Mitsui Financial Group NYSE:SMFG

$25.89 +1.00 (+4.03%)
Closing price 03:59 PM Eastern
Extended Trading
$26.09 +0.20 (+0.76%)
As of 07:40 PM Eastern
Extended trading is trading that happens on electronic markets outside of regular trading hours. This is a fair market value extended hours price provided by Massive. Learn more.

Sumitomo Mitsui Financial Group, Inc, together with its subsidiaries, provides banking, leasing, securities, credit card, and consumer finance services in Japan, the Americas, Europe, the Middle East, Asia, and Oceania. More about Sumitomo Mitsui Financial Group

Pros of Sumitomo Mitsui Financial Group

  • The current stock price is around $23.60, which is near its 50-day moving average, indicating potential stability in the short term.
  • With a net margin of 15.68%, the company demonstrates strong profitability, suggesting efficient management and a solid business model.
  • A return on equity of 10.19% indicates that the company is effectively using shareholders' equity to generate profits, which is a positive sign for investors.

Cons of Sumitomo Mitsui Financial Group

  • The debt-to-equity ratio of 1.48 indicates that the company has a relatively high level of debt compared to its equity, which could pose risks in times of economic downturn.
  • With a beta of 0.42, the stock is less volatile than the market, which may limit potential high returns for investors seeking aggressive growth.
  • The current ratio and quick ratio both stand at 1.06, suggesting that the company has just enough short-term assets to cover its short-term liabilities, which may raise concerns about liquidity.
A.I. GeneratedThese insights were generated using artificial intelligence. They are based on proprietary MarketBeat data, news articles, and custom LLM A.I. algorithms.
Market Capitalization
$158.78 billion
P/E Ratio
19.32
Consensus Rating
Moderate Buy
Consensus Price Target
N/A
Volume
1.28 million shares
Average Volume
1.80 million shares
Today's Range
$25.57
$26.03
50-Day Range
$21.72
$26.45
52-Week Range
$14.86
$26.67
Dividend Yield
1.87%
Interactive Brokers Group stock logo

19. Interactive Brokers Group NASDAQ:IBKR

$94.42 +2.74 (+2.99%)
Closing price 04:00 PM Eastern
Extended Trading
$93.75 -0.67 (-0.71%)
As of 07:59 PM Eastern
Extended trading is trading that happens on electronic markets outside of regular trading hours. This is a fair market value extended hours price provided by Massive. Learn more.

Interactive Brokers Group, Inc operates as an automated electronic broker worldwide. The company engages in the execution, clearance, and settlement of trades in stocks, options, futures, foreign exchange instruments, bonds, mutual funds, exchange traded funds (ETFs), precious metals, and cryptocurrencies. More about Interactive Brokers Group

Pros of Interactive Brokers Group

  • The company recently reported earnings per share of $0.60, exceeding analysts' expectations, which indicates strong financial performance and effective management.
  • Interactive Brokers Group, Inc. has shown a year-over-year revenue increase of 17.0%, suggesting robust growth and a positive outlook for future earnings.
  • The current stock price is around $80, which may present a favorable entry point for investors looking for growth in the financial services sector.

Cons of Interactive Brokers Group

  • The company’s revenue for the latest quarter was slightly below consensus estimates, which may raise concerns about its ability to meet future growth expectations.
  • Despite the increase in dividend, the yield is only 0.4%, which may not be attractive for income-focused investors seeking higher returns from dividends.
  • Interactive Brokers Group, Inc. has a return on equity of 5.19%, which, while positive, may be considered low compared to industry peers, indicating less efficiency in generating profits from shareholders' equity.
A.I. GeneratedThese insights were generated using artificial intelligence. They are based on proprietary MarketBeat data, news articles, and custom LLM A.I. algorithms.
Market Capitalization
$155.52 billion
P/E Ratio
40.70
Consensus Rating
Moderate Buy
Consensus Price Target
$93.89 (-0.6% Downside)
Volume
5.10 million shares
Average Volume
4.15 million shares
Today's Range
$93.29
$95.55
50-Day Range
$80.95
$97.41
52-Week Range
$58.95
$97.84
Dividend Yield
0.38%
Banco Bilbao Viscaya Argentaria stock logo

20. Banco Bilbao Viscaya Argentaria NYSE:BBVA

$25.70 +0.58 (+2.30%)
Closing price 03:59 PM Eastern
Extended Trading
$25.66 -0.03 (-0.12%)
As of 04:10 PM Eastern
Extended trading is trading that happens on electronic markets outside of regular trading hours. This is a fair market value extended hours price provided by Massive. Learn more.

Banco Bilbao Vizcaya Argentaria, SA provides retail banking, wholesale banking, and asset management services in the United States, Spain, Mexico, Turkey, South America, and internationally. More about Banco Bilbao Viscaya Argentaria

Pros of Banco Bilbao Viscaya Argentaria

  • The current stock price is around $23.59, which is near its fifty-day moving average, indicating potential stability in the stock's performance.
  • Banco Bilbao Vizcaya Argentaria, S.A. reported a strong quarterly earnings per share (EPS) of $0.59, showcasing its profitability and operational efficiency.
  • The bank has a robust net margin of 28.21%, suggesting effective cost management and a strong ability to convert revenue into profit.

Cons of Banco Bilbao Viscaya Argentaria

  • The stock has a 12-month high of $26.40, which may indicate that it is currently trading at a lower valuation compared to its peak, potentially signaling volatility.
  • Recent institutional trading shows mixed activity, with some investors increasing their holdings while others may be cautious, reflecting uncertainty in market sentiment.
  • Despite strong earnings, the bank operates in a competitive environment, which could pressure margins and growth in the future.
A.I. GeneratedThese insights were generated using artificial intelligence. They are based on proprietary MarketBeat data, news articles, and custom LLM A.I. algorithms.
Market Capitalization
$143.41 billion
P/E Ratio
12.24
Consensus Rating
Hold
Consensus Price Target
N/A
Volume
753,399 shares
Average Volume
1.18 million shares
Today's Range
$25.50
$25.79
50-Day Range
$21.63
$26.12
52-Week Range
$14.63
$26.40
Dividend Yield
4.53%
Prologis stock logo

21. Prologis NYSE:PLD

$149.90 +2.42 (+1.64%)
Closing price 03:59 PM Eastern
Extended Trading
$149.65 -0.25 (-0.17%)
As of 07:59 PM Eastern
Extended trading is trading that happens on electronic markets outside of regular trading hours. This is a fair market value extended hours price provided by Massive. Learn more.

Prologis, Inc is the global leader in logistics real estate with a focus on high-barrier, high-growth markets. At March 31, 2024, the company owned or had investments in, on a wholly owned basis or through co-investment ventures, properties and development projects expected to total approximately 1.2 billion square feet (115 million square meters) in 19 countries. More about Prologis

Pros of Prologis

  • The company has demonstrated strong revenue growth, with quarterly revenue increasing significantly compared to the same period last year, indicating robust business performance.
  • Prologis, Inc. recently declared a quarterly dividend of $1.07 per share, reflecting a commitment to returning value to shareholders. This translates to an annualized dividend yield of approximately 3.0%, which can be attractive for income-focused investors.
  • Analysts have a consensus rating of "Moderate Buy" for Prologis, Inc., with a favorable average price target suggesting potential for stock appreciation.

Cons of Prologis

  • The company's dividend payout ratio is currently over 107%, which indicates that it is paying out more in dividends than it is earning. This could raise concerns about the sustainability of future dividends.
  • Insider selling activity has been noted, with the CFO recently selling a significant number of shares, which may signal a lack of confidence in the stock's short-term performance.
  • While the stock has a positive outlook, the real estate sector can be sensitive to economic fluctuations, and any downturn could impact Prologis, Inc.'s performance.
A.I. GeneratedThese insights were generated using artificial intelligence. They are based on proprietary MarketBeat data, news articles, and custom LLM A.I. algorithms.
Market Capitalization
$137.50 billion
P/E Ratio
33.38
Consensus Rating
Moderate Buy
Consensus Price Target
$153.62 (+2.5% Upside)
Volume
3.26 million shares
Average Volume
3.82 million shares
Today's Range
$146.72
$150.02
50-Day Range
$135.50
$149.96
52-Week Range
$103.41
$153.35
Dividend Yield
2.90%
Chubb stock logo

22. Chubb NYSE:CB

$355.04 +2.51 (+0.71%)
Closing price 03:59 PM Eastern
Extended Trading
$353.44 -1.60 (-0.45%)
As of 07:57 PM Eastern
Extended trading is trading that happens on electronic markets outside of regular trading hours. This is a fair market value extended hours price provided by Massive. Learn more.

Chubb Limited provides insurance and reinsurance products worldwide. The company's North America Commercial P&C Insurance segment offers commercial property, casualty, workers' compensation, package policies, risk management, financial lines, marine, construction, environmental, medical risk, cyber risk, surety, and casualty; and group accident and health insurance to large, middle market, and small commercial businesses. More about Chubb

Pros of Chubb

  • Chubb Limited has recently increased its quarterly dividend to $1.02 per share, reflecting a commitment to returning value to shareholders. This increase from the previous dividend indicates strong financial health and a positive outlook.
  • The company reported a robust earnings per share (EPS) of $6.82 for the last quarter, showcasing its profitability and operational efficiency, which can attract investors looking for solid financial performance.
  • Chubb Limited has a favorable net margin of 18.58%, indicating that it retains a significant portion of revenue as profit, which is a positive sign for potential investors.

Cons of Chubb

  • Chubb Limited has a relatively low current ratio of 0.28, which may indicate potential liquidity issues, as it suggests the company might struggle to cover its short-term liabilities.
  • The stock has experienced fluctuations, with a 1-year low of $264.10, which could raise concerns about its stability and the potential for further declines.
  • Despite a strong EPS, the company has a PE ratio of 12.25, which may suggest that the stock is overvalued compared to its earnings, potentially deterring value-focused investors.
A.I. GeneratedThese insights were generated using artificial intelligence. They are based on proprietary MarketBeat data, news articles, and custom LLM A.I. algorithms.
Market Capitalization
$136.73 billion
P/E Ratio
12.54
Consensus Rating
Hold
Consensus Price Target
$359.09 (+1.1% Upside)
Volume
2.36 million shares
Average Volume
1.73 million shares
Today's Range
$348.27
$355.52
50-Day Range
$310.32
$360.90
52-Week Range
$264.10
$365.29
Dividend Yield
1.16%
S&P Global stock logo

23. S&P Global NYSE:SPGI

$430.69 -17.66 (-3.94%)
Closing price 03:59 PM Eastern
Extended Trading
$431.56 +0.87 (+0.20%)
As of 07:51 PM Eastern
Extended trading is trading that happens on electronic markets outside of regular trading hours. This is a fair market value extended hours price provided by Massive. Learn more.

S&P Global, Inc engages in the provision of transparent and independent ratings, benchmarks, analytics, and data to the capital and commodity markets worldwide. More about S&P Global

Pros of S&P Global

  • The current stock price is around $419, which reflects a strong performance compared to its 1-year low of $381.61 and high of $579.05, indicating potential for growth.
  • The company reported a significant increase in revenue, with a year-over-year growth of over 10%, showcasing its ability to expand and generate more income.
  • S&P Global Inc. has a solid return on equity of 17.26%, which suggests effective management and profitability in generating returns for shareholders.

Cons of S&P Global

  • The dividend yield is relatively low at around 0.9%, which may not be appealing for income-focused investors looking for higher returns from dividends.
  • The quick ratio and current ratio are both at 0.68, indicating potential liquidity concerns, as the company may not have enough short-term assets to cover its short-term liabilities.
  • Despite recent revenue growth, the earnings per share have decreased from $4.37 in the same quarter last year, which could signal challenges in maintaining profitability.
A.I. GeneratedThese insights were generated using artificial intelligence. They are based on proprietary MarketBeat data, news articles, and custom LLM A.I. algorithms.
Market Capitalization
$132.71 billion
P/E Ratio
27.26
Consensus Rating
Moderate Buy
Consensus Price Target
$533.59 (+23.9% Upside)
Volume
1.63 million shares
Average Volume
2.34 million shares
Today's Range
$427.63
$441.23
50-Day Range
$395.41
$457.34
52-Week Range
$381.61
$579.05
Dividend Yield
0.87%
Capital One Financial stock logo

24. Capital One Financial NYSE:COF

$206.33 -0.44 (-0.21%)
Closing price 03:59 PM Eastern
Extended Trading
$207.08 +0.75 (+0.36%)
As of 07:59 PM Eastern
Extended trading is trading that happens on electronic markets outside of regular trading hours. This is a fair market value extended hours price provided by Massive. Learn more.

Capital One Financial Corporation operates as the financial services holding company for the Capital One, National Association, which engages in the provision of various financial products and services in the United States, Canada, and the United Kingdom. More about Capital One Financial

Pros of Capital One Financial

  • The company recently reported a significant increase in quarterly revenue, up over 52% year-over-year, indicating strong growth potential.
  • Capital One Financial Co. has a projected earnings per share (EPS) of approximately 19.55 for the current fiscal year, suggesting robust profitability.
  • The current stock price is around $258, which reflects a positive market sentiment and potential for further appreciation.

Cons of Capital One Financial

  • The high dividend payout ratio of 112.28% suggests that the company is paying out more in dividends than it earns, which could be unsustainable in the long run.
  • Some analysts have downgraded their price targets, indicating potential concerns about future growth and market conditions.
  • Increased competition in the banking and credit card sectors may pressure Capital One Financial Co.'s market share and profitability.
A.I. GeneratedThese insights were generated using artificial intelligence. They are based on proprietary MarketBeat data, news articles, and custom LLM A.I. algorithms.
Market Capitalization
$128.67 billion
P/E Ratio
72.40
Consensus Rating
Moderate Buy
Consensus Price Target
$259.91 (+26.0% Upside)
Volume
3.96 million shares
Average Volume
4.08 million shares
Today's Range
$203.12
$207.41
50-Day Range
$177.75
$211.86
52-Week Range
$174.24
$259.64
Dividend Yield
1.55%
Bank Of Montreal stock logo

25. Bank Of Montreal NYSE:BMO

$178.76 +0.76 (+0.43%)
Closing price 03:59 PM Eastern
Extended Trading
$183.50 +4.74 (+2.65%)
As of 07:51 PM Eastern
Extended trading is trading that happens on electronic markets outside of regular trading hours. This is a fair market value extended hours price provided by Massive. Learn more.

Bank of Montreal provides diversified financial services primarily in North America. It operates through Canadian P&C, U.S P&C, BMO Wealth Management, and BMO Capital Markets segments. The company's personal banking products and services include deposits, mortgages, home lending, consumer credit, small business lending, credit cards, cash management, financial and investment advice, and other banking services; and commercial banking products and services comprise various of financing options and treasury and payment solutions, as well as risk management products. It also offers investing, banking, and wealth management advisory; digital investing services; financial solutions for individuals, families, and businesses; provides investment management services to institutional, retail, and high net worth investors; and diversified insurance, and wealth and pension de-risking solutions. In addition, the company provides individual life, critical illness and annuity products, as well as segregated funds, and group creditor and travel insurance to customers; debt and equity capital-raising, loan origination and syndication, balance sheet management, treasury management, mergers and acquisitions advice, restructurings and recapitalizations, trade finance, and risk mitigation services, as well as a range of banking and other operating services. Further, the company offers research and access to financial markets for institutional, corporate and retail clients through an integrated suite of sales and trading solutions related to debt, foreign exchange, interest rates, credit, equities, securitization, and commodities; provides new product development and origination services, as well as risk management and advisory services for hedging strategies, including in interest rates, foreign exchange rates and commodities prices; and funding and liquidity management services. The company was founded in 1817 and is headquartered in Montreal, Canada.

Market Capitalization
$124.67 billion
P/E Ratio
18.98
Consensus Rating
Hold
Consensus Price Target
$163.00 (-8.8% Downside)
Volume
1.23 million shares
Average Volume
715,367 shares
Today's Range
$177.39
$179.56
50-Day Range
$150.16
$183.70
52-Week Range
$109.64
$184.21
Dividend Yield
2.70%
Progressive stock logo

26. Progressive NYSE:PGR

$205.78 -6.45 (-3.04%)
Closing price 03:59 PM Eastern
Extended Trading
$206.40 +0.62 (+0.30%)
As of 07:55 PM Eastern
Extended trading is trading that happens on electronic markets outside of regular trading hours. This is a fair market value extended hours price provided by Massive. Learn more.

The Progressive Corporation, an insurance holding company, provides personal and commercial auto, personal residential and commercial property, business related general liability, and other specialty property-casualty insurance products and related services in the United States. More about Progressive

Pros of Progressive

  • The current stock price is around $205, which may present a buying opportunity for investors looking for value in the insurance sector.
  • The Progressive Co. has demonstrated strong financial performance, with a net margin of nearly 13%, indicating effective cost management and profitability.
  • With a return on equity of over 33%, the company shows a high level of efficiency in generating profits from shareholders' equity, which is attractive to investors.

Cons of Progressive

  • The company has a quick ratio and current ratio of 0.27, indicating potential liquidity issues, which could affect its ability to meet short-term obligations.
  • Despite the revenue growth, the company reported quarterly revenue that fell short of analyst estimates, which may raise concerns about future performance.
  • The dividend yield is relatively low at 0.2%, which may not be appealing for income-focused investors seeking higher returns from dividends.
A.I. GeneratedThese insights were generated using artificial intelligence. They are based on proprietary MarketBeat data, news articles, and custom LLM A.I. algorithms.
Market Capitalization
$124.01 billion
P/E Ratio
10.32
Consensus Rating
Hold
Consensus Price Target
$235.05 (+14.2% Upside)
Volume
3.32 million shares
Average Volume
3.57 million shares
Today's Range
$205.37
$211.33
50-Day Range
$190.27
$234.84
52-Week Range
$189.20
$254.93
Dividend Yield
0.19%
Mizuho Financial Group stock logo

27. Mizuho Financial Group NYSE:MFG

$10.36 +0.52 (+5.23%)
Closing price 03:59 PM Eastern
Extended Trading
$10.28 -0.07 (-0.68%)
As of 07:34 PM Eastern
Extended trading is trading that happens on electronic markets outside of regular trading hours. This is a fair market value extended hours price provided by Massive. Learn more.

Mizuho Financial Group, Inc, together with its subsidiaries, engages in banking, trust, securities, and other businesses related to financial services in Japan, the Americas, Europe, Asia/Oceania, and internationally. More about Mizuho Financial Group

Pros of Mizuho Financial Group

  • The current stock price is around $9, reflecting a stable position in the market, which may indicate investor confidence.
  • Mizuho Financial Group, Inc. has shown growth in institutional investment, with several firms increasing their stakes, suggesting strong market interest and potential for future appreciation.
  • The company operates a diverse range of financial services, including retail and corporate banking, which can provide resilience against market fluctuations.

Cons of Mizuho Financial Group

  • Institutional investors and hedge funds own only a small percentage (3.26%) of the company's stock, which may indicate a lack of confidence from larger investment entities.
  • The banking sector is facing increasing regulatory scrutiny, which could impact operational flexibility and profitability for Mizuho Financial Group, Inc.
  • Recent market volatility may pose risks to the company's performance, particularly in its investment banking and asset management segments.
A.I. GeneratedThese insights were generated using artificial intelligence. They are based on proprietary MarketBeat data, news articles, and custom LLM A.I. algorithms.
Market Capitalization
$121.53 billion
P/E Ratio
13.63
Consensus Rating
Moderate Buy
Consensus Price Target
N/A
Volume
2.42 million shares
Average Volume
3.99 million shares
Today's Range
$10.18
$10.39
50-Day Range
$8.39
$10.66
52-Week Range
$5.69
$10.78
Dividend Yield
1.43%
HDFC Bank stock logo

28. HDFC Bank NYSE:HDB

$23.78 +0.18 (+0.74%)
Closing price 03:59 PM Eastern
Extended Trading
$23.88 +0.11 (+0.46%)
As of 07:57 PM Eastern
Extended trading is trading that happens on electronic markets outside of regular trading hours. This is a fair market value extended hours price provided by Massive. Learn more.

HDFC Bank Limited provides banking and financial services to individuals and businesses in India, Bahrain, Hong Kong, and Dubai. More about HDFC Bank

Pros of HDFC Bank

  • The current stock price is around $24.88, which is near its 50-day simple moving average, indicating potential stability in the short term.
  • HDFC Bank Limited has a strong presence in the Indian banking sector, providing a wide range of services including retail and corporate banking, which can attract diverse customer segments.
  • The bank has shown resilience with a 52-week high of $39.81, suggesting strong performance and investor confidence over the past year.

Cons of HDFC Bank

  • The stock has experienced volatility, with a 52-week low of $22.91, which may raise concerns about its stability in the market.
  • As a foreign bank, HDFC Bank Limited may face regulatory challenges and geopolitical risks that could impact its operations and profitability.
  • Increased competition in the Indian banking sector from both traditional banks and fintech companies could pressure profit margins and market share.
A.I. GeneratedThese insights were generated using artificial intelligence. They are based on proprietary MarketBeat data, news articles, and custom LLM A.I. algorithms.
Market Capitalization
$120.39 billion
P/E Ratio
13.99
Consensus Rating
Hold
Consensus Price Target
N/A
Volume
11.44 million shares
Average Volume
7.87 million shares
Today's Range
$23.55
$23.94
50-Day Range
$23.04
$27.41
52-Week Range
$22.91
$39.81
Dividend Yield
1.50%
Bank of New York Mellon stock logo

29. Bank of New York Mellon NYSE:BNY

$158.58 +1.65 (+1.05%)
As of 03:58 PM Eastern

The Bank of New York Mellon Corporation provides a range of financial products and services in the United States and internationally. The company operates through Securities Services, Market and Wealth Services, Investment and Wealth Management, and other segments. The Securities Services segment offers custody, trust and depositary, accounting, exchange-traded funds, middle-office solutions, transfer agency, services for private equity and real estate funds, foreign exchange, securities lending, liquidity/lending services, and data analytics. This segment also provides trustee, paying agency, fiduciary, escrow and other financial, issuer, and support services for brokers and investors. The Market and Wealth Services segment offers clearing and custody, investment, wealth and retirement solutions, technology and enterprise data management, trading, and prime brokerage services. This segment also provides integrated cash management solutions, including payments, foreign exchange, liquidity management, receivables processing and payables management, and trade finance and processing services. The Investment and Wealth Management segment offers investment management strategies and distribution of investment products, investment management, custody, wealth and estate planning, private banking, investment, and information management services. The Other segment engages in the provision of leasing, corporate treasury, derivative and other trading, corporate and bank-owned life insurance, renewable energy investment, and business exit services. It serves central banks and sovereigns, financial institutions, asset managers, insurance companies, corporations, local authorities and high net-worth individuals, and family offices. The Bank of New York Mellon Corporation was founded in 1784 and is headquartered in New York, New York.

Market Capitalization
$107.71 billion
P/E Ratio
18.46
Consensus Rating
Moderate Buy
Consensus Price Target
$154.79 (-2.4% Downside)
Volume
4.14 million shares
Average Volume
4.52 million shares
Today's Range
$156.50
$159.13
50-Day Range
$134.89
$162.58
52-Week Range
$98.03
$163.77
Dividend Yield
1.35%
Canadian Imperial Bank of Commerce stock logo

30. Canadian Imperial Bank of Commerce NYSE:CM

$117.43 -0.37 (-0.31%)
Closing price 03:59 PM Eastern
Extended Trading
$117.36 -0.07 (-0.06%)
As of 07:34 PM Eastern
Extended trading is trading that happens on electronic markets outside of regular trading hours. This is a fair market value extended hours price provided by Massive. Learn more.

Canadian Imperial Bank of Commerce, a diversified financial institution, provides various financial products and services to personal, business, public sector, and institutional clients in Canada, the United States, and internationally. More about Canadian Imperial Bank of Commerce

Pros of Canadian Imperial Bank of Commerce

  • The bank recently reported earnings per share that exceeded analyst expectations, indicating strong financial performance and effective management.
  • With a revenue increase of over 15% year-over-year, Canadian Imperial Bank of Commerce demonstrates robust growth potential, appealing to growth-oriented investors.
  • The current stock price is around $60, which may present a favorable entry point for new investors looking to capitalize on potential future gains.

Cons of Canadian Imperial Bank of Commerce

  • The bank's net margin has shown some fluctuation, which could indicate potential challenges in maintaining profitability in a competitive market.
  • Recent earnings reports show a decline in earnings per share compared to the previous year, which may raise concerns about future growth sustainability.
  • Institutional ownership is significant, with nearly 50% of shares held by institutional investors, which could lead to volatility if these investors decide to sell.
A.I. GeneratedThese insights were generated using artificial intelligence. They are based on proprietary MarketBeat data, news articles, and custom LLM A.I. algorithms.
Market Capitalization
$107.53 billion
P/E Ratio
16.13
Consensus Rating
Moderate Buy
Consensus Price Target
$167.00 (+42.2% Upside)
Volume
972,616 shares
Average Volume
1.73 million shares
Today's Range
$116.99
$118.23
50-Day Range
$106.04
$121.26
52-Week Range
$71.00
$122.50
Dividend Yield
2.63%
ICICI Bank stock logo

31. ICICI Bank NYSE:IBN

$30.03 +0.27 (+0.92%)
Closing price 03:59 PM Eastern
Extended Trading
$29.91 -0.12 (-0.41%)
As of 07:49 PM Eastern
Extended trading is trading that happens on electronic markets outside of regular trading hours. This is a fair market value extended hours price provided by Massive. Learn more.

ICICI Bank Limited provides various banking products and services in India and internationally. It operates through Retail Banking, Wholesale Banking, Treasury, Other Banking, Life Insurance, and Others segments. More about ICICI Bank

Pros of ICICI Bank

  • The current stock price is around $20, reflecting a strong position in the market.
  • ICICI Bank Limited has a diverse range of banking products and services, catering to both retail and corporate customers, which can lead to stable revenue streams.
  • Institutional investors currently own 18.18% of the stock, indicating confidence in the bank's performance and potential for growth.

Cons of ICICI Bank

  • As a major player in the banking sector, ICICI Bank Limited is subject to regulatory changes that could impact its operations and profitability.
  • The competitive landscape in the banking industry is intense, which may pressure profit margins and market share.
  • Economic fluctuations can affect loan demand and repayment rates, potentially leading to increased non-performing assets.
A.I. GeneratedThese insights were generated using artificial intelligence. They are based on proprietary MarketBeat data, news articles, and custom LLM A.I. algorithms.
Market Capitalization
$106.74 billion
P/E Ratio
19.01
Consensus Rating
Hold
Consensus Price Target
N/A
Volume
8.31 million shares
Average Volume
7.39 million shares
Today's Range
$29.87
$30.35
50-Day Range
$25.23
$30.06
52-Week Range
$25.08
$34.54
Dividend Yield
0.71%
Bank of Nova Scotia stock logo

32. Bank of Nova Scotia NYSE:BNS

$87.41 +0.35 (+0.40%)
Closing price 03:59 PM Eastern
Extended Trading
$87.37 -0.04 (-0.04%)
As of 07:34 PM Eastern
Extended trading is trading that happens on electronic markets outside of regular trading hours. This is a fair market value extended hours price provided by Massive. Learn more.

The Bank of Nova Scotia provides various banking products and services in Canada, the United States, Mexico, Peru, Chile, Colombia, the Caribbean and Central America, and internationally. More about Bank of Nova Scotia

Pros of Bank of Nova Scotia

  • The current stock price is around $82, which is significantly lower than its 12-month high of $88.17, indicating potential for price appreciation.
  • The Bank of Nova Scotia reported a strong quarterly earnings per share (EPS) of $1.47, exceeding analysts' expectations, which reflects robust financial performance.
  • With a net margin of 13.38%, the bank demonstrates effective cost management and profitability, making it an attractive investment option.

Cons of Bank of Nova Scotia

  • The stock has a price-to-earnings (P/E) ratio of 16.79, which may be considered high compared to industry averages, potentially indicating overvaluation.
  • The company has a debt-to-equity ratio of 0.69, which, while manageable, suggests a reliance on debt financing that could pose risks in a rising interest rate environment.
  • Despite recent earnings growth, the EPS of $1.47 is lower than the $1.52 reported in the same quarter last year, indicating a potential decline in profitability.
A.I. GeneratedThese insights were generated using artificial intelligence. They are based on proprietary MarketBeat data, news articles, and custom LLM A.I. algorithms.
Market Capitalization
$106.64 billion
P/E Ratio
16.68
Consensus Rating
Hold
Consensus Price Target
$117.00 (+33.9% Upside)
Volume
1.78 million shares
Average Volume
3.01 million shares
Today's Range
$86.69
$87.71
50-Day Range
$76.42
$90.33
52-Week Range
$55.21
$90.47
Dividend Yield
3.69%
Brookfield stock logo

33. Brookfield NYSE:BN

$42.18 -0.21 (-0.48%)
Closing price 03:59 PM Eastern
Extended Trading
$42.10 -0.08 (-0.20%)
As of 08:00 PM Eastern
Extended trading is trading that happens on electronic markets outside of regular trading hours. This is a fair market value extended hours price provided by Massive. Learn more.

Brookfield Corporation is an alternative asset manager and REIT/Real Estate Investment Manager firm focuses on real estate, renewable power, infrastructure and venture capital and private equity assets. More about Brookfield

Pros of Brookfield

  • The current stock price is around $43.38, which may present a buying opportunity for investors looking for growth in the real estate and alternative asset management sectors.
  • Brookfield Co. has received multiple "overweight" ratings from analysts, indicating strong confidence in its future performance and potential for price appreciation.
  • The company has a diverse investment portfolio across real estate, renewable power, and infrastructure, which can help mitigate risks associated with market volatility.

Cons of Brookfield

  • The company has a high PE ratio of 85.06, which may indicate that the stock is overvalued compared to its earnings, potentially leading to a price correction.
  • Brookfield Co. has a debt-to-equity ratio of 1.54, suggesting a reliance on debt financing, which can increase financial risk, especially in a rising interest rate environment.
  • Despite its strong market position, the stock has experienced fluctuations, with a 1-year low of $37.93, indicating potential volatility that could deter risk-averse investors.
A.I. GeneratedThese insights were generated using artificial intelligence. They are based on proprietary MarketBeat data, news articles, and custom LLM A.I. algorithms.
Market Capitalization
$103.90 billion
P/E Ratio
82.72
Consensus Rating
Moderate Buy
Consensus Price Target
$56.64 (+34.3% Upside)
Volume
4.18 million shares
Average Volume
3.35 million shares
Today's Range
$42.15
$42.60
50-Day Range
$42.16
$47.56
52-Week Range
$37.93
$49.56
Dividend Yield
0.66%
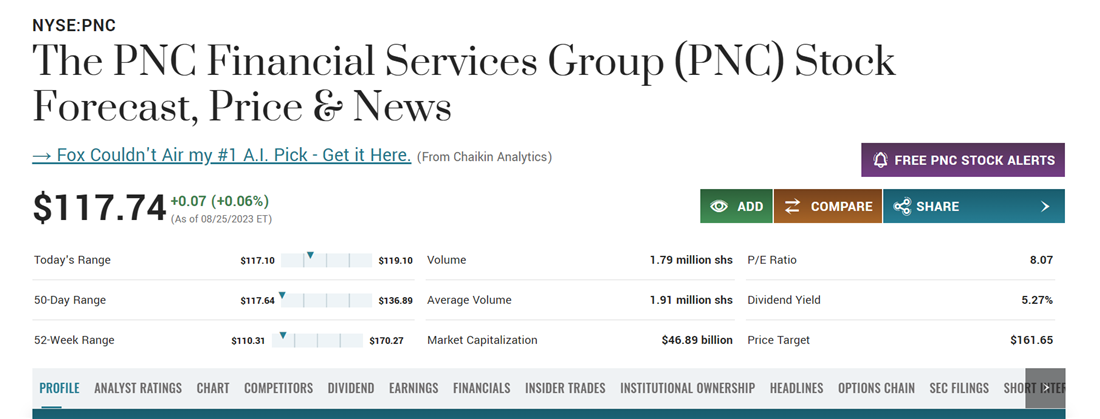
The PNC Financial Services Group stock logo

34. The PNC Financial Services Group NYSE:PNC

$250.37 +0.23 (+0.09%)
Closing price 03:59 PM Eastern
Extended Trading
$248.68 -1.69 (-0.68%)
As of 07:48 PM Eastern
Extended trading is trading that happens on electronic markets outside of regular trading hours. This is a fair market value extended hours price provided by Massive. Learn more.

The PNC Financial Services Group, Inc operates as a diversified financial services company in the United States. It operates through three segments: Retail Banking, Corporate & Institutional Banking, and Asset Management Group segments. More about The PNC Financial Services Group

Pros of The PNC Financial Services Group

  • The current stock price is around $229.90, which is near its 200-day moving average, indicating stability in its recent performance.
  • The company has demonstrated strong earnings growth, with a reported EPS of $4.32, surpassing analyst expectations, which reflects its robust financial health.
  • With a market capitalization of approximately $101.19 billion, The PNC Financial Services Group, Inc. is well-positioned in the financial services sector, suggesting a strong market presence.

Cons of The PNC Financial Services Group

  • The company has a debt-to-equity ratio of 1.05, which indicates a higher level of debt compared to equity, potentially increasing financial risk.
  • With a current ratio of 0.83, The PNC Financial Services Group, Inc. may face challenges in meeting short-term liabilities, suggesting liquidity concerns.
  • The quick ratio of 0.82 further emphasizes potential liquidity issues, as it measures the ability to cover current liabilities without relying on inventory sales.
A.I. GeneratedThese insights were generated using artificial intelligence. They are based on proprietary MarketBeat data, news articles, and custom LLM A.I. algorithms.
Market Capitalization
$100.45 billion
P/E Ratio
13.78
Consensus Rating
Moderate Buy
Consensus Price Target
$265.50 (+6.0% Upside)
Volume
1.75 million shares
Average Volume
2.21 million shares
Today's Range
$247.43
$251.25
50-Day Range
$209.80
$255.24
52-Week Range
$176.88
$256.49
Dividend Yield
3.20%
Equinix stock logo

35. Equinix NASDAQ:EQIX

$1,027.88 +10.57 (+1.04%)
Closing price 04:00 PM Eastern
Extended Trading
$1,030.95 +3.07 (+0.30%)
As of 07:56 PM Eastern
Extended trading is trading that happens on electronic markets outside of regular trading hours. This is a fair market value extended hours price provided by Massive. Learn more.

Equinix (Nasdaq: EQIX) is the world's digital infrastructure company . Digital leaders harness Equinix's trusted platform to bring together and interconnect foundational infrastructure at software speed. More about Equinix

Pros of Equinix

  • Equinix, Inc. reported a significant increase in quarterly revenue, showing a year-over-year growth of nearly 10%, indicating strong demand for its services.
  • The company has set ambitious earnings per share (EPS) guidance for FY 2026, suggesting confidence in future profitability and growth potential.
  • Equinix, Inc. recently announced a quarterly dividend of $5.16 per share, translating to an annualized dividend yield of approximately 2.1%, which can provide a steady income stream for investors.

Cons of Equinix

  • The dividend payout ratio is quite high at 142.84%, which may raise concerns about the sustainability of future dividends if earnings do not continue to grow.
  • Despite the revenue growth, the company reported a net margin of only 15.07%, which may indicate challenges in maintaining profitability as competition increases.
  • Some analysts have downgraded their ratings on Equinix, Inc., suggesting that there may be underlying concerns about the stock's valuation or market conditions.
A.I. GeneratedThese insights were generated using artificial intelligence. They are based on proprietary MarketBeat data, news articles, and custom LLM A.I. algorithms.
Market Capitalization
$100.33 billion
P/E Ratio
71.13
Consensus Rating
Moderate Buy
Consensus Price Target
$1,155.64 (+12.4% Upside)
Volume
537,851 shares
Average Volume
588,217 shares
Today's Range
$1,018.40
$1,036.33
50-Day Range
$998.84
$1,115.94
52-Week Range
$720.62
$1,128.68
Dividend Yield
2.03%
U.S. Bancorp stock logo

36. U.S. Bancorp NYSE:USB

$63.68 +0.55 (+0.86%)
Closing price 03:59 PM Eastern
Extended Trading
$63.53 -0.16 (-0.25%)
As of 07:56 PM Eastern
Extended trading is trading that happens on electronic markets outside of regular trading hours. This is a fair market value extended hours price provided by Massive. Learn more.

U.S. Bancorp, a financial services holding company, provides various financial services to individuals, businesses, institutional organizations, governmental entities, and other financial institutions in the United States. More about U.S. Bancorp

Pros of U.S. Bancorp

  • U.S. Bancorp recently reported quarterly earnings of $1.35 per share, exceeding Wall Street expectations, indicating strong financial performance and effective management.
  • The company achieved record quarterly revenue of $7.71 billion, driven by robust loan growth and increased fee revenue, showcasing its operational strength.
  • Management has raised its revenue guidance for 2026, suggesting confidence in continued growth and positive market conditions.

Cons of U.S. Bancorp

  • There are concerns regarding higher expense growth, which could impact profitability despite the positive earnings report.
  • While the company has shown strong performance, the broader economic environment remains uncertain, which could affect future growth.
  • Some analysts have issued a "Hold" rating, indicating that not all market participants are convinced of the stock's upside potential.
A.I. GeneratedThese insights were generated using artificial intelligence. They are based on proprietary MarketBeat data, news articles, and custom LLM A.I. algorithms.
Market Capitalization
$97.94 billion
P/E Ratio
12.71
Consensus Rating
Moderate Buy
Consensus Price Target
$67.00 (+5.2% Upside)
Volume
9.60 million shares
Average Volume
8.66 million shares
Today's Range
$62.64
$63.75
50-Day Range
$52.70
$63.89
52-Week Range
$43.46
$64.84
Dividend Yield
3.29%
ING Group stock logo

37. ING Group NYSE:ING

$33.10 +0.90 (+2.79%)
Closing price 03:59 PM Eastern
Extended Trading
$33.38 +0.28 (+0.84%)
As of 07:59 PM Eastern
Extended trading is trading that happens on electronic markets outside of regular trading hours. This is a fair market value extended hours price provided by Massive. Learn more.

ING Groep N.V. provides various banking products and services in the Netherlands, Belgium, Germany, rest of Europe, and internationally. More about ING Group

Pros of ING Group

  • The current stock price is around $28.98, which may present a buying opportunity for investors looking for value.
  • Recent short interest has decreased, indicating a potential shift in market sentiment towards a more favorable outlook for ING Groep.
  • With an average daily trading volume of over 2.4 million shares, ING Groep offers good liquidity, allowing investors to enter and exit positions with ease.

Cons of ING Group

  • Institutional ownership is currently at 0%, which may indicate a lack of confidence from larger investors.
  • The short percentage of float is relatively low, suggesting that there may not be significant upside potential in the short term.
  • Recent performance metrics show a month-to-month decrease in shares shorted, which could reflect a cautious approach from investors.
A.I. GeneratedThese insights were generated using artificial intelligence. They are based on proprietary MarketBeat data, news articles, and custom LLM A.I. algorithms.
Market Capitalization
$93.71 billion
P/E Ratio
13.08
Consensus Rating
Moderate Buy
Consensus Price Target
N/A
Volume
2.54 million shares
Average Volume
3.10 million shares
Today's Range
$32.75
$33.20
50-Day Range
$28.72
$33.31
52-Week Range
$22.53
$33.35
Dividend Yield
4.54%
Barclays stock logo

38. Barclays NYSE:BCS

$27.96 +0.72 (+2.62%)
Closing price 03:59 PM Eastern
Extended Trading
$28.20 +0.25 (+0.88%)
As of 07:56 PM Eastern
Extended trading is trading that happens on electronic markets outside of regular trading hours. This is a fair market value extended hours price provided by Massive. Learn more.

Barclays PLC provides various financial services in the United Kingdom, Europe, the Americas, Africa, the Middle East, and Asia. The company operates through Barclays UK and Barclays International division segments. It offers financial services, such as retail banking, credit cards, wholesale banking, investment banking, wealth management, and investment management services. In addition, the company engages in securities dealing activities. The company was formerly known as Barclays Bank Limited and changed its name to Barclays PLC in January 1985. Barclays PLC was founded in 1690 and is headquartered in London, the United Kingdom.

Market Capitalization
$92.85 billion
P/E Ratio
11.65
Consensus Rating
Moderate Buy
Consensus Price Target
N/A
Volume
5.55 million shares
Average Volume
4.62 million shares
Today's Range
$27.52
$28.13
50-Day Range
$22.53
$28.38
52-Week Range
$18.68
$28.43
Dividend Yield
2.12%
Itau Unibanco stock logo

39. Itau Unibanco NYSE:ITUB

$8.38 +0.07 (+0.78%)
Closing price 03:59 PM Eastern
Extended Trading
$8.40 +0.01 (+0.12%)
As of 07:34 PM Eastern
Extended trading is trading that happens on electronic markets outside of regular trading hours. This is a fair market value extended hours price provided by Massive. Learn more.

Itaú Unibanco Holding S.A. offers a range of financial products and services to individuals and corporate customers in Brazil and internationally. The company operates through three segments: Retail Banking, Wholesale Banking, and Activities with the Market + Corporation. It offers current account; loans; credit and debit cards; investment and commercial banking services; real estate lending services; financing and investment services; economic, financial and brokerage advisory; and leasing and foreign exchange services. The company also provides property and casualty insurance products covering loss, damage, or liabilities for assets or persons, as well as life insurance products covering death and personal accident. It serves retail customers, account and non-account holders, individuals and legal entities, high income clients, microenterprises, and small companies, as well as middle-market companies and high net worth clients. The company was formerly known as Itaú Unibanco Banco Múltiplo S.A. and changed its name to Itaú Unibanco Holding S.A. in April 2009. The company was incorporated in 1924 and is headquartered in São Paulo, Brazil. Itaú Unibanco Holding S.A. operates as a subsidiary of IUPAR - Itaú Unibanco Participações S.A.

Market Capitalization
$92.16 billion
P/E Ratio
11.50
Consensus Rating
Moderate Buy
Consensus Price Target
$10.00 (+19.3% Upside)
Volume
12.83 million shares
Average Volume
19.73 million shares
Today's Range
$8.30
$8.40
50-Day Range
$7.41
$8.64
52-Week Range
$5.93
$9.60
Dividend Yield
0.39%
Blackstone stock logo

40. Blackstone NYSE:BX

$124.13 +0.52 (+0.42%)
Closing price 03:59 PM Eastern
Extended Trading
$124.30 +0.17 (+0.14%)
As of 07:58 PM Eastern
Extended trading is trading that happens on electronic markets outside of regular trading hours. This is a fair market value extended hours price provided by Massive. Learn more.

Blackstone Inc is an alternative asset management firm specializing in real estate, private equity, hedge fund solutions, credit, secondary funds of funds, public debt and equity and multi-asset class strategies. More about Blackstone

Pros of Blackstone

  • The current stock price is around $119, which is significantly lower than its 52-week high, indicating potential for growth.
  • Blackstone Inc. reported a strong earnings per share (EPS) of $1.36 for the latest quarter, surpassing analyst expectations, which reflects solid financial performance.
  • The company has shown a revenue increase of 10% compared to the same quarter last year, indicating robust business growth.

Cons of Blackstone

  • The company has a high dividend payout ratio of 118.67%, which may indicate that it is returning more to shareholders than it is earning, potentially unsustainable in the long term.
  • Blackstone Inc. has a beta of 1.58, suggesting that its stock is more volatile than the market, which could pose risks for conservative investors.
  • The quick and current ratios are both at 0.76, indicating potential liquidity issues, as these ratios are below the ideal benchmark of 1.
A.I. GeneratedThese insights were generated using artificial intelligence. They are based on proprietary MarketBeat data, news articles, and custom LLM A.I. algorithms.
Market Capitalization
$91.83 billion
P/E Ratio
31.75
Consensus Rating
Moderate Buy
Consensus Price Target
$145.71 (+17.4% Upside)
Volume
4.74 million shares
Average Volume
4.52 million shares
Today's Range
$123.15
$125.20
50-Day Range
$110.42
$128.73
52-Week Range
$101.73
$190.09
Dividend Yield
3.75%
Robinhood Markets stock logo

41. Robinhood Markets NASDAQ:HOOD

$106.36 +7.08 (+7.13%)
Closing price 04:00 PM Eastern
Extended Trading
$107.14 +0.78 (+0.73%)
As of 07:59 PM Eastern
Extended trading is trading that happens on electronic markets outside of regular trading hours. This is a fair market value extended hours price provided by Massive. Learn more.

Robinhood Markets, Inc. operates financial services platform in the United States. Its platform allows users to invest in stocks, exchange-traded funds (ETFs), American depository receipts, options, gold, and cryptocurrencies. The company offers fractional trading, recurring investments, fully-paid securities lending, access to investing on margin, cash sweep, instant withdrawals, retirement program, around-the-clock trading, and initial public offerings participation services. It also provides various learning and education solutions comprise Snacks, an accessible digest of business news stories for a new generation of investors.; Learn, which is an online collection of beginners' guides, feature tutorials, and financial dictionary; Newsfeeds that offer access to free, premium news from sites from various sites, such as Barron's, Reuters, and Dow Jones. In addition, the company offers In-App Education, a resource that covers investing fundamentals, including why people invest, a stock market overview, and tips on how to define investing goals, as well as allows customers to understand the basics of investing before their first trade; and Crypto Learn and Earn, an educational module available to various crypto customers through Robinhood Learn to teach customers the basics related to cryptocurrency. Further, it provides Robinhood credit cards, cash card and spending accounts, and wallets. Robinhood Markets, Inc. was incorporated in 2013 and is headquartered in Menlo Park, California.

Market Capitalization
$89.40 billion
P/E Ratio
51.38
Consensus Rating
Moderate Buy
Consensus Price Target
$121.13 (+13.9% Upside)
Volume
19.61 million shares
Average Volume
24.44 million shares
Today's Range
$102.82
$108.21
50-Day Range
$73.64
$117.55
52-Week Range
$63.51
$153.86
Dividend Yield
N/A
CME Group stock logo

42. CME Group NASDAQ:CME

$237.41 -7.70 (-3.14%)
Closing price 04:00 PM Eastern
Extended Trading
$238.82 +1.41 (+0.60%)
As of 07:52 PM Eastern
Extended trading is trading that happens on electronic markets outside of regular trading hours. This is a fair market value extended hours price provided by Massive. Learn more.

CME Group Inc, together with its subsidiaries, operates contract markets for the trading of futures and options on futures contracts worldwide. More about CME Group

Pros of CME Group

  • The current stock price is around $267, which reflects a strong performance compared to its 52-week low of $218.31 and high of $329.16, indicating potential for growth.
  • CME Group Inc. reported a significant increase in revenue, with a year-over-year growth of 14.5%, showcasing its ability to expand and generate more income.
  • The company has a high net margin of 63.19%, which suggests that it retains a large portion of its revenue as profit, making it an attractive option for investors seeking profitability.

Cons of CME Group

  • The P/E ratio of 20.19 indicates that the stock may be overvalued compared to its earnings, which could deter value-focused investors.
  • The price-to-earnings-growth (P/E/G) ratio of 2.64 suggests that the stock's growth may not justify its current price, raising concerns about future returns.
  • Despite a strong performance, the beta of 0.25 indicates lower volatility, which may not appeal to investors looking for high-risk, high-reward opportunities.
A.I. GeneratedThese insights were generated using artificial intelligence. They are based on proprietary MarketBeat data, news articles, and custom LLM A.I. algorithms.
Market Capitalization
$88.82 billion
P/E Ratio
20.26
Consensus Rating
Moderate Buy
Consensus Price Target
$292.12 (+23.0% Upside)
Volume
3.61 million shares
Average Volume
3.44 million shares
Today's Range
$237.14
$243.72
50-Day Range
$218.58
$305.12
52-Week Range
$218.31
$329.16
Dividend Yield
2.12%
Moody's stock logo

43. Moody's NYSE:MCO

$489.24 -16.13 (-3.19%)
Closing price 03:59 PM Eastern
Extended Trading
$491.48 +2.23 (+0.46%)
As of 08:00 PM Eastern
Extended trading is trading that happens on electronic markets outside of regular trading hours. This is a fair market value extended hours price provided by Massive. Learn more.

Moody's Corporation operates as an integrated risk assessment firm worldwide. It operates in two segments, Moody's Analytics and Moody's Investors Services. More about Moody's

Pros of Moody's

  • The company recently reported an 8.1% increase in revenue compared to the same quarter last year, indicating strong financial performance and growth potential.
  • Moody's Co. has set its FY 2026 earnings per share (EPS) guidance between 16.400 and 17.000, suggesting confidence in future profitability.
  • Analysts expect Moody's Co. to post earnings per share of approximately 16.71 for the current year, reflecting positive market sentiment.

Cons of Moody's

  • Insider selling activity has been noted, with the CEO selling shares recently, which could raise concerns about the company's future outlook from those within the organization.
  • Some analysts have downgraded their ratings on Moody's Co., indicating a potential shift in market perception and caution among investors.
  • The stock has seen fluctuations in price targets from various analysts, with some reducing their expectations, which may signal uncertainty in the stock's future performance.
A.I. GeneratedThese insights were generated using artificial intelligence. They are based on proprietary MarketBeat data, news articles, and custom LLM A.I. algorithms.
Market Capitalization
$88.29 billion
P/E Ratio
35.07
Consensus Rating
Moderate Buy
Consensus Price Target
$550.58 (+12.5% Upside)
Volume
1.43 million shares
Average Volume
918,312 shares
Today's Range
$482.69
$496.87
50-Day Range
$428.93
$517.65
52-Week Range
$402.28
$546.88
Dividend Yield
0.82%
Marsh & McLennan Companies stock logo

44. Marsh & McLennan Companies NYSE:MRSH

$181.36 -0.75 (-0.41%)
Closing price 03:59 PM Eastern
Extended Trading
$178.12 -3.23 (-1.78%)
As of 07:53 PM Eastern
Extended trading is trading that happens on electronic markets outside of regular trading hours. This is a fair market value extended hours price provided by Massive. Learn more.

Marsh & McLennan Cos., Inc. is a professional services firm, which engages in offering clients advice and solutions in risk, strategy, and people. It operates through the Risk and Insurance Services, and Consulting segments. The Risk and Insurance Services segment is involved in risk management activities, as well as insurance and reinsurance broking and services. The Consulting segment offers health, wealth, and career solutions and products, and specialized management, strategic, economic, and brand consulting services. The company was founded by Henry W. Marsh and Donald R. McLennan in 1871 and is headquartered in New York, NY.

Market Capitalization
$87.97 billion
P/E Ratio
22.67
Consensus Rating
Hold
Consensus Price Target
$200.81 (+10.7% Upside)
Volume
2.99 million shares
Average Volume
2.46 million shares
Today's Range
$181.18
$189.08
50-Day Range
$0.00
$0.00
52-Week Range
$156.60
$213.80
Dividend Yield
1.98%
KKR & Co. Inc. stock logo

45. KKR & Co. Inc. NYSE:KKR

$97.04 +0.07 (+0.08%)
Closing price 03:59 PM Eastern
Extended Trading
$97.12 +0.08 (+0.08%)
As of 07:34 PM Eastern
Extended trading is trading that happens on electronic markets outside of regular trading hours. This is a fair market value extended hours price provided by Massive. Learn more.

KKR & Co, Inc operates as an investment firm. It offers alternative asset management as well as capital markets and insurance solutions. More about KKR & Co. Inc.

Pros of KKR & Co. Inc.

  • Kohlberg Kravis Roberts & Co. L.P. has a strong reputation in leveraged buyouts, which can lead to significant returns on investment.
  • The firm has diversified its investment strategies, including private equity, credit, and real assets, allowing for a broader range of opportunities.
  • The current stock price is around $50, which may present a buying opportunity for investors looking for value.

Cons of KKR & Co. Inc.

  • Market volatility can impact the performance of alternative investments, which may lead to unpredictable returns.
  • As a global investment firm, KKR is exposed to geopolitical risks that could affect its international operations and investments.
  • Competition in the private equity space is intense, which may pressure margins and limit growth potential.
A.I. GeneratedThese insights were generated using artificial intelligence. They are based on proprietary MarketBeat data, news articles, and custom LLM A.I. algorithms.
Market Capitalization
$87.07 billion
P/E Ratio
33.01
Consensus Rating
Moderate Buy
Consensus Price Target
$128.08 (+32.0% Upside)
Volume
2.86 million shares
Average Volume
4.48 million shares
Today's Range
$96.50
$98.07
50-Day Range
$89.03
$102.57
52-Week Range
$82.67
$153.87
Dividend Yield
0.80%
Lloyds Banking Group stock logo

46. Lloyds Banking Group NYSE:LYG

$6.06 +0.18 (+2.98%)
Closing price 03:59 PM Eastern
Extended Trading
$6.00 -0.05 (-0.83%)
As of 07:50 PM Eastern
Extended trading is trading that happens on electronic markets outside of regular trading hours. This is a fair market value extended hours price provided by Massive. Learn more.

Lloyds Banking Group plc, together with its subsidiaries, provides a range of banking and financial services in the United Kingdom and internationally. More about Lloyds Banking Group

Pros of Lloyds Banking Group

  • The current stock price is around $6.87, reflecting a stable performance in the financial market.
  • Lloyds Banking Group plc has demonstrated a strong return on equity of over 10%, indicating effective management and profitability.
  • The company recently announced a dividend of $0.134, which represents a significant yield, making it attractive for income-focused investors.

Cons of Lloyds Banking Group

  • The company recently reported revenue that fell short of analysts' expectations, which may raise concerns about its growth trajectory.
  • Despite a decent net margin, it has shown a slight decline compared to previous periods, which could indicate potential challenges ahead.
  • Some analysts have downgraded their ratings on the stock, reflecting mixed sentiments in the market.
A.I. GeneratedThese insights were generated using artificial intelligence. They are based on proprietary MarketBeat data, news articles, and custom LLM A.I. algorithms.
Market Capitalization
$85.65 billion
P/E Ratio
13.76
Consensus Rating
Moderate Buy
Consensus Price Target
N/A
Volume
11.70 million shares
Average Volume
17.93 million shares
Today's Range
$5.95
$6.10
50-Day Range
$5.06
$6.16
52-Week Range
$4.05
$6.34
Dividend Yield
4.34%
Intercontinental Exchange stock logo

47. Intercontinental Exchange NYSE:ICE

$138.50 -3.07 (-2.17%)
Closing price 03:59 PM Eastern
Extended Trading
$140.19 +1.69 (+1.22%)
As of 07:53 PM Eastern
Extended trading is trading that happens on electronic markets outside of regular trading hours. This is a fair market value extended hours price provided by Massive. Learn more.

Intercontinental Exchange, Inc, together with its subsidiaries, engages in the provision of market infrastructure, data services, and technology solutions for financial institutions, corporations, and government entities in the United States, the United Kingdom, the European Union, Singapore, India, Abu Dhabi, Israel, and Canada. More about Intercontinental Exchange

Pros of Intercontinental Exchange

  • The company has shown strong financial performance, with a recent earnings report indicating a significant year-over-year revenue increase of over 20%.
  • Intercontinental Exchange, Inc. has a solid market capitalization of approximately $76.29 billion, indicating a strong position in the financial services sector.
  • The current stock price is around $156, which is within a range that analysts consider attractive based on recent price targets.

Cons of Intercontinental Exchange

  • Insider selling has been observed, with key executives recently reducing their holdings, which may signal a lack of confidence in the stock's short-term performance.
  • The stock has experienced fluctuations, with a 1-year high of $189.35 and a low of $121.79, indicating potential volatility that could concern risk-averse investors.
  • Despite strong revenue growth, the price-to-earnings ratio of 19.64 suggests that the stock may be overvalued compared to its earnings, which could deter some investors.
A.I. GeneratedThese insights were generated using artificial intelligence. They are based on proprietary MarketBeat data, news articles, and custom LLM A.I. algorithms.
Market Capitalization
$80.06 billion
P/E Ratio
20.16
Consensus Rating
Moderate Buy
Consensus Price Target
$181.58 (+31.1% Upside)
Volume
2.28 million shares
Average Volume
4.49 million shares
Today's Range
$138.39
$140.85
50-Day Range
$122.76
$156.08
52-Week Range
$121.79
$189.35
Dividend Yield
1.47%
American Tower stock logo

48. American Tower NYSE:AMT

$163.19 -3.87 (-2.32%)
Closing price 03:59 PM Eastern
Extended Trading
$164.47 +1.28 (+0.78%)
As of 07:55 PM Eastern
Extended trading is trading that happens on electronic markets outside of regular trading hours. This is a fair market value extended hours price provided by Massive. Learn more.

American Tower, one of the largest global REITs, is a leading independent owner, operator and developer of multitenant communications real estate with a portfolio of over 224,000 communications sites and a highly interconnected footprint of U.S. More about American Tower

Pros of American Tower

  • The company has set its FY 2026 guidance for earnings per share between 10.900 and 11.07, indicating strong growth potential.
  • American Tower Co. recently announced a quarterly dividend of $1.79 per share, which translates to an annualized dividend of $7.16, providing a solid income stream for investors.
  • The current stock price is around $178, reflecting a stable investment opportunity in the communications infrastructure sector.

Cons of American Tower

  • The dividend payout ratio is currently at 115.67%, which suggests that the company is paying out more in dividends than it earns, raising concerns about sustainability.
  • Insider ownership is relatively low at 0.08%, which may indicate a lack of confidence from executives in the company's future performance.
  • Recent insider transactions, such as the sale of shares by an executive vice president, could signal potential concerns about the company's stock performance.
A.I. GeneratedThese insights were generated using artificial intelligence. They are based on proprietary MarketBeat data, news articles, and custom LLM A.I. algorithms.
Market Capitalization
$77.83 billion
P/E Ratio
26.36
Consensus Rating
Moderate Buy
Consensus Price Target
$215.57 (+32.1% Upside)
Volume
2.76 million shares
Average Volume
3.32 million shares
Today's Range
$163.07
$166.61
50-Day Range
$162.02
$194.34
52-Week Range
$160.06
$234.33
Dividend Yield
4.29%
Brookfield Asset Management stock logo

49. Brookfield Asset Management NYSE:BAM

$46.58 -0.80 (-1.68%)
Closing price 03:59 PM Eastern
Extended Trading
$46.95 +0.37 (+0.80%)
As of 07:54 PM Eastern
Extended trading is trading that happens on electronic markets outside of regular trading hours. This is a fair market value extended hours price provided by Massive. Learn more.

Brookfield Asset Management Ltd. is a real estate investment firm specializing in alternative asset management services. Its renewable power and transition business includes the operates in the hydroelectric, wind, solar, distributed generation, and sustainable solution sector. The company's infrastructure business engages in the utilities, transport, midstream, and data infrastructure sectors. In addition, its private equity business offers industrial, infrastructure, and business services sectors; and real estate business, which includes housing, logistics, hospitality, science and innovation, office, and retail sectors. Further, it provides credit business; and insurance solution in the reinsurance, annuities, operating platform, and investment solutions sectors. Brookfield Asset Management Ltd. was incorporated in 2022 and is headquartered in Toronto, Canada.

Market Capitalization
$77.60 billion
P/E Ratio
30.24
Consensus Rating
Hold
Consensus Price Target
$60.03 (+28.9% Upside)
Volume
2.12 million shares
Average Volume
2.46 million shares
Today's Range
$46.53
$47.53
50-Day Range
$44.03
$49.51
52-Week Range
$42.20
$64.10
Dividend Yield
4.24%
AON stock logo

50. AON NYSE:AON

$358.82 -3.96 (-1.09%)
Closing price 03:59 PM Eastern
Extended Trading
$360.24 +1.41 (+0.39%)
As of 07:57 PM Eastern
Extended trading is trading that happens on electronic markets outside of regular trading hours. This is a fair market value extended hours price provided by Massive. Learn more.

Aon Plc engages in the provision of risk, health, and wealth solutions. It focuses on risk capital including claim management, reinsurance, risk analysis, management, retention, and transfer; and human capital involving analytics, health and benefits, investments, pensions and retirement, talent and rewards, and workplace wellbeing. More about AON

Pros of AON

  • The current stock price is around $330, which is near its 50-day moving average, indicating potential stability in the short term.
  • Aon plc has demonstrated strong financial performance, with a recent earnings per share (EPS) of $6.48, surpassing analyst expectations, which reflects effective management and operational efficiency.
  • The company has a solid return on equity of 43.50%, suggesting that it is effective in generating profits from its equity investments, which is attractive for investors seeking growth.

Cons of AON

  • The company has a relatively high debt-to-equity ratio of 1.36, which may indicate higher financial risk, as it relies more on debt financing compared to equity.
  • Despite recent revenue growth, the year-over-year EPS has decreased from $5.67 to $6.48, which could signal potential challenges in maintaining profitability.
  • Aon plc's PEG ratio of 1.89 suggests that the stock may be overvalued relative to its earnings growth, which could deter value-focused investors.
A.I. GeneratedThese insights were generated using artificial intelligence. They are based on proprietary MarketBeat data, news articles, and custom LLM A.I. algorithms.
Market Capitalization
$77.48 billion
P/E Ratio
19.69
Consensus Rating
Moderate Buy
Consensus Price Target
$404.56 (+12.7% Upside)
Volume
1.26 million shares
Average Volume
1.49 million shares
Today's Range
$354.80
$363.00
50-Day Range
$311.07
$368.16
52-Week Range
$304.59
$381.00
Dividend Yield
0.90%