The heatmap determines liquidity is in the market and how liquidity providers behave. In other words, it helps traders determine where the actual orders in the market are being made.
Price Charts: Does a Better Method Exist?
Since the equity and futures markets first developed, most traders have relied upon price charts to understand the behavior and psychology of other traders and institutions. In the early days of trading, these price charts were made up of lines or bars. Since the late 1980s, they have been made up of “candles” that show an open, close, high and low for the given time period.
These types of charts offer a tried-and-true method for understanding the market. They offer a better way to trade than relying on a “gut feeling” to make trades. These methods were also developed during a time when computers were much less powerful than they are today and when many sources of market information were not available. This means there may be better ways of understanding the market today than have been available so far.
For example, before the 1980s, there was no publicly available information about limit orders. If you were a soybean trader before the 1980s, there was no way for you to know if a sell order for 1,000 contracts of soybeans had been made at $16 per bushel. Today, this information is available. Since these types of orders ultimately determine the price, it is possible to develop a charting method that provides this information.
This is what the heatmap does. It provides a better method of charting financial assets because it charts the actual determinants of price and the orders themselves instead of the consequences.
What is the Heatmap?
The heatmap is a visual representation of the limit orders put into the order book. The right side of the vertical timeline shows the current order book. The left side of the vertical timeline shows the position of the order book in the past. This information is recorded as a color-coded map.
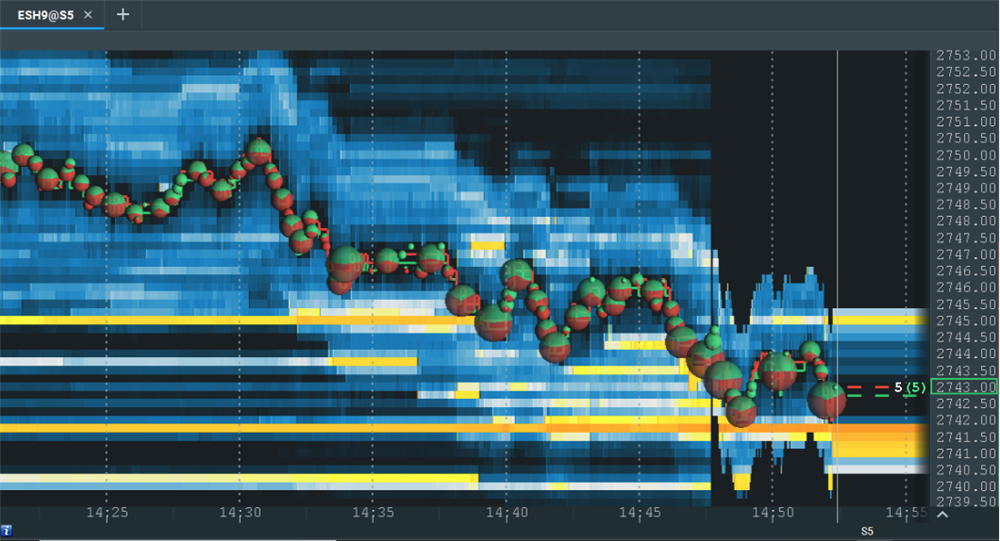
In this image, you can see a large number of limit “buy” orders at $2,741.50 (orange line). The red dotted line is the “best ask” (lowest price limit sell order). The green dotted line is the “best bid” (highest price limit buy order). When the best bid and ask first began to hit the area of high liquidity at $2,741, they rose.
They are now testing the area again and you can see support at this level. There is also a large number of limit sell orders at $2,745, as represented by the yellow line at that level. This implies that if the best bid and ask rise to $2,745, you can expect resistance.
In Bookmap, there is no limitation on zoom. Traders can analyze the market on different time frames up to nanoseconds (although in practice it’s not necessary). Here is an example of a higher resolution view:
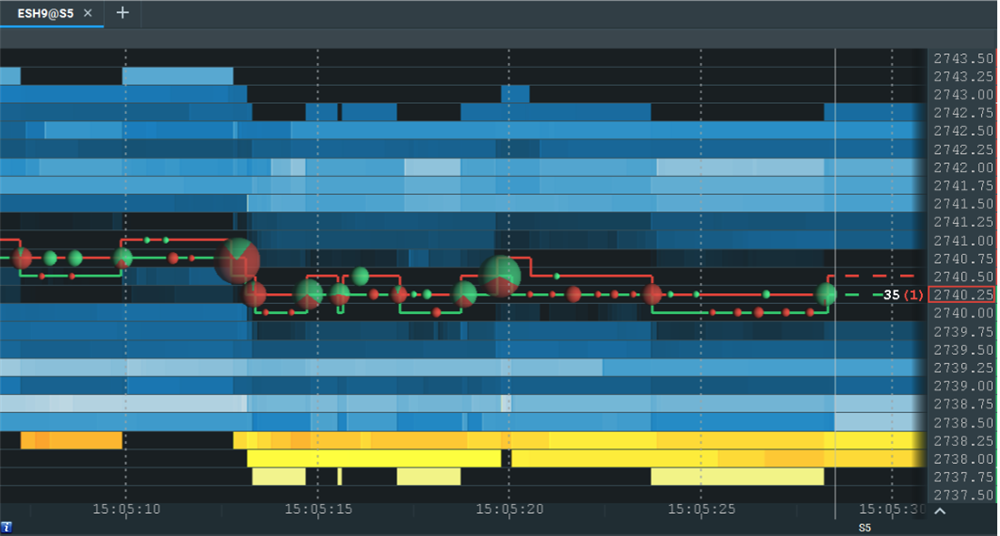
This provides a close-up shot of the best ask (red line) and best bid (green line). The price of the most recent transaction is indicated with a rectangle on the right side of the screen. In this case, the most recent transaction was a market sell order for $2,740.25. This transaction occurred at the best bid (the highest price limit buy order).
The bubbles shown indicate the volume of market orders. A green bubble means there were significantly more market buys than market sells. A red bubble means the opposite (significantly more market sells than market buys). A bubble that is partially red or green indicates that the ratio between market “sells” and “buys” was more balanced.
Profitable Trading with the Heatmap
The heatmap is not a trading system nor an indicator. It doesn’t tell you when to buy or sell. It simply provides accurate information about what market participants are doing. To the extent that inaccurate information leads to bad trades, Bookmap’s heatmap can help you eliminate this problem. This can lead to a more profitable trading business.
However, the heatmap does not interpret market data for you. In our educational materials, we provide theories as to what order book information “means” in one context or another. Ultimately, you must decide how to trade based on the information Bookmap gives you.
A good analogy for trading with Bookmap is real-time multiplayer games. If you play online poker, for example, you can choose to pay attention to other players’ behavior. You can pay attention to whether a player bets or folds in certain circumstances. You may still misinterpret why a player bets or folds, but at least you have more information than you would if you only paid attention to your own cards. The heatmap displays true and non-aggregated market depth data with a precision of up to the pixel resolution of your monitor, allowing you to see what the other players do. This should be better than not being able to see their actions.
Market Data Visualization in The Era of HFT and AI
High-frequency trading computers can execute round-trip trades within milliseconds. Artificial intelligence (AI) algorithms can detect patterns in vast amounts of market data. As human day traders, we do not want to compete against any of these powers.
So, what is the area in which a chart trader can still get a competitive advantage over machines? The answer is visualization. A quick proof of it is the existence of Captchas:
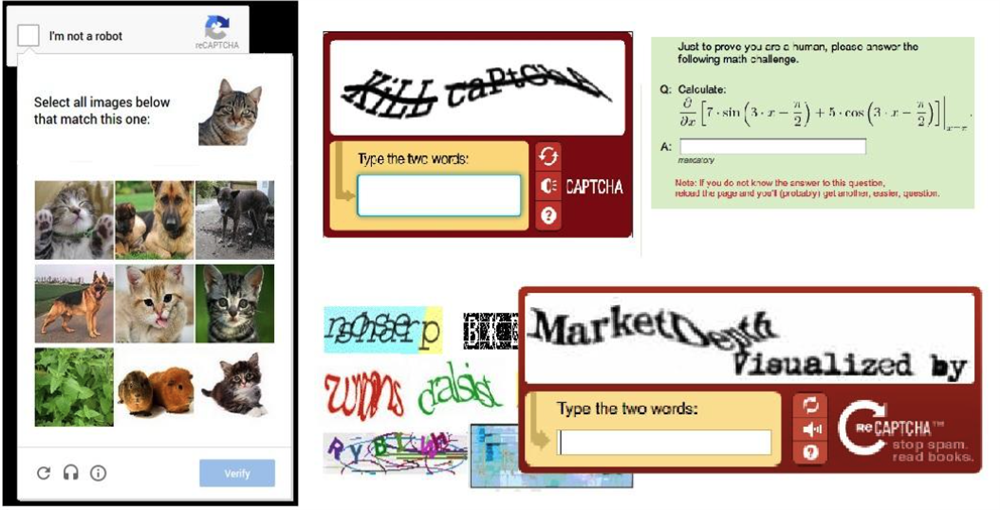
The reason captchas are being used is because of the human ability to spot complex patterns better than computer programs.
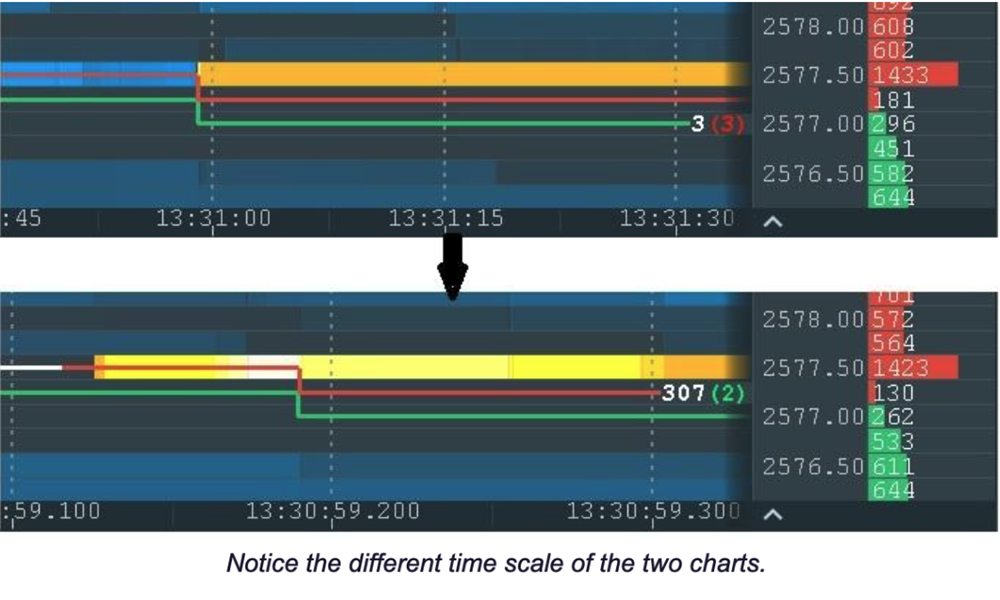
We can also observe a similar “proof” using Bookmap itself. Take a look at the image below. We can determine that it was generated by a single trader with a single glance, and we can see how it affects the price. Those familiar with computer science and machine learning understand how challenging it would be to detect this with a computer program in real time.
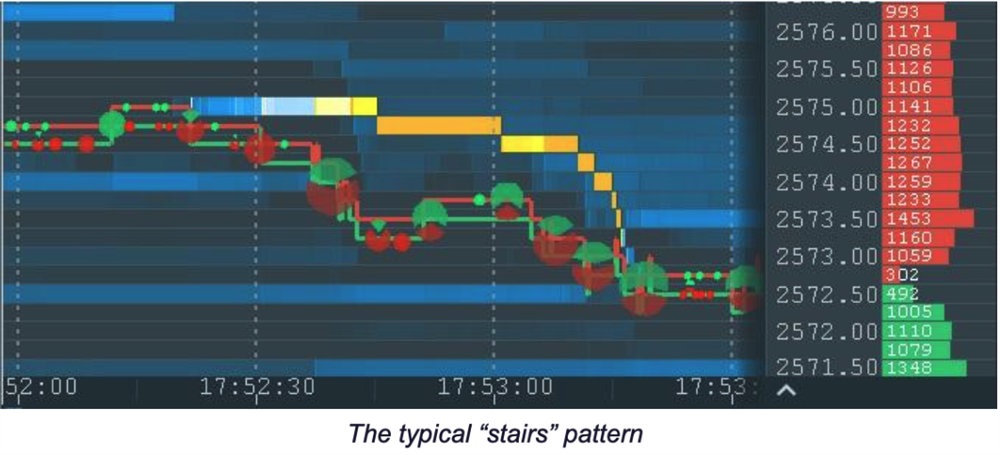
The pattern consists of just several order replacements, but this small chart snapshot contains many thousands of market data events. This is a noise that such a program must filter out. In addition, the program must deal with the noise generated by this trader in a form of different time intervals and order size during order modifications.
Large traders are usually more influential on the market than small traders. On one hand, they can use their weight to move the market in the desired direction. On the other hand, they have the challenge to execute or manage large orders due to liquidity constraints. Because of this, they try to keep their activity undetected to mask the fact that this activity belongs to a single trader.
One of the techniques they use to obscure their activity is to split large orders into smaller orders and place them one by one. To make it even more difficult for other robots, they add “noise” in a form of nonequal sizes of smaller orders and nonequal time periods between them. This is an effective method against other robots, but the human eye can spot it with a glance, as shown below.
Here is another example which is even more complicated for computer vision but still easy for human sight:
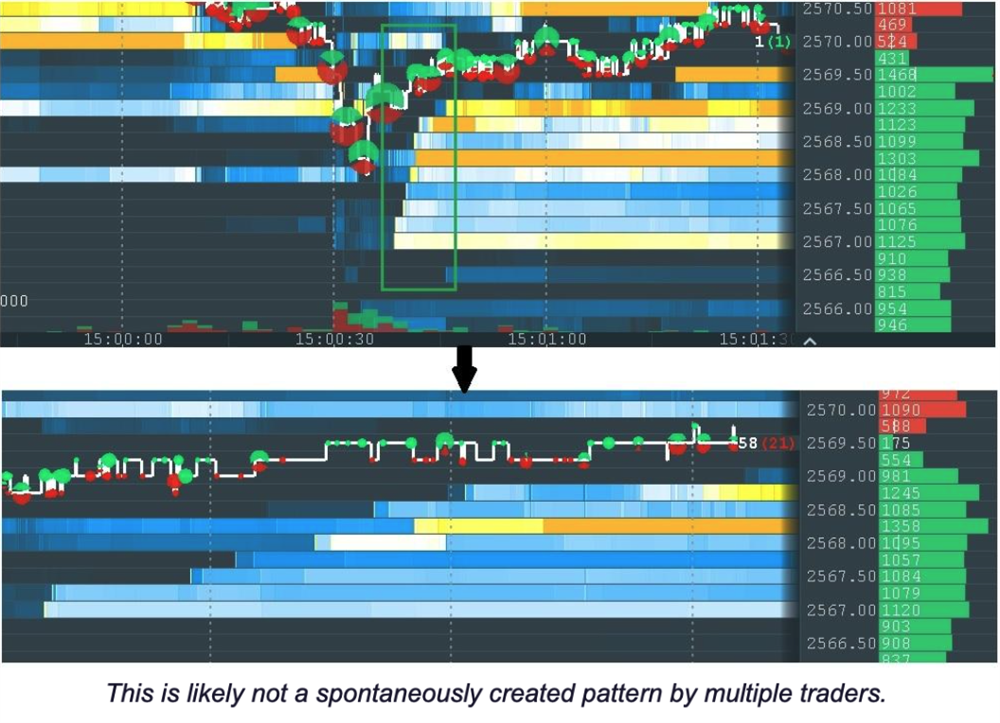
This is how the heatmap can be used in trading. By visualizing liquidity, the heatmap allows a trader to get the same information the robo-trading algorithms have access to, but with the added advantage of human sight and human understanding.
Like any other tool in trading, this doesn’t guarantee success but it does offer an excellent means of gaining an edge over other traders who do not have it.
Visit the Bookmap website to learn more.
Before you make your next trade, you'll want to hear this.
MarketBeat keeps track of Wall Street's top-rated and best performing research analysts and the stocks they recommend to their clients on a daily basis.
Our team has identified the five stocks that top analysts are quietly whispering to their clients to buy now before the broader market catches on... and none of the big name stocks were on the list.
They believe these five stocks are the five best companies for investors to buy now...
See The Five Stocks Here
Robotics and automation are rapidly becoming essential infrastructure across healthcare, manufacturing, logistics, and many other industries.
"Physical AI" is coming to the United States, and there are four ways that investors can gain exposure to this new robotics revolution. Plus, learn which seven companies are most positioned to benefit as intelligent robots enter the workforce.
Get This Free Report