International payments transfer platform
MoneyGram International NYSE: MGI stock was buoyed on takeover speculation in July, but shares have since pulled back into bargain territory again. As the world’s third-largest cross-border
payments platform, the Company amassed speculation of preliminary takeover interest from private equity firm Advent International and Stellar Development Foundation. Neither companies commented and the fervor eventually fizzled, enabling shares to
bottom out at $8.27. While the potential for an acquisition is still possible, the shares are trading rather cheaply. MoneyGram has been a rumored acquisition target from various suitors from Ant Financial in 2018 to Ripple Labs to rival Western Union
NYSE: WU last June. The Company is a
post-pandemic recovery play as the reopenings have bolstered its top-line growth. The continued global
reopening is a boon for the Company as it enables P2P payments in over 200 countries. The Company continues to
grow its MoneyGram Online service enabling instant transfers and payouts globally. Prudent investors seeking a stable play in the
transformative world of money transfer platforms can watch for pullbacks in shares of MoneyGram.
Q2 FY 2021 Earnings Release
On July 29, 2021, MoneyGram released its fiscal second-quarter 2021 results for the quarter ending June 2021. The Company reported diluted adjust earnings-per-share (EPS) loss of (-$0.16) excluding non-recurring items. Adjusted EBITDA grew 22% YoY excluding the $8.8 million Ripple incentives. Operating income was flat at $21.9 million. Total revenues rose 18% YoY to $329.3 million. Money trader revenue was $304.9 million, up 20% YoY reporting an all-time high for transactions and volume. Cross-border online revenue grew 68% YoY and active cross-border customers grew 54%. MoneyGram CEO Alex Holmes commented, We delivered strong top and bottom-line financial performance in the second quarter on revenue growth of 18% driven by a record number of online customers and transactions. During the quarter, we exited our DPA and significantly reduced our cost of capital through the combination of our efficient equity offering and successful execution of our debt refinancing. Our newly improved capital structure, coupled with our second-quarter results, represent a significant milestone on our transformational journey. As we enter a new era of growth and improved cash flow, the underlying strength in our business and the execution of our customer-centric strategy highlight the substantial opportunity ahead. I couldn't be more pleased with our accomplishments in the quarter and I'm extremely excited about the future of the Company."
Conference Call Takeaways
CEO Holmes set the tone, “Business performance in the second quarter exceeded expectations as we delivered revenue growth of 18% on the strength of a record number of digital customers, a 20% increase in both money transfer revenue and transactions and a 41% increase in cross-border volume. Total money transfer transactions and volume both represented record numbers for the company. And perhaps equally impressive to note when comparing this quarter's money transfer numbers to the second quarter of 2019, prior to COVID, we delivered strong transaction growth of 17% and revenue growth of 18%. Growth this quarter was once again driven by the incredible performance of our digital business led by the largest component, MoneyGram Online. In the quarter, MoneyGram Online delivered record highs for customers, transactions, volume, and revenue. Now a fun fact to note here. If you aggregate our top 10 MoneyGram Online markets, MoneyGram Online has grown to account for 29% of all transactions in those markets. This is up approximately 3x from just 2 years ago and demonstrates a significant diversification of our business in these markets that collectively represent over 75% of our total lens.” He also noted that digital transactions account for 33% of all money transfers.
Competition
New competitors entered the field offering extreme discounted fees to Mexico, “In the U.S., we reported double-digit U.S. outbound growth and successfully managed the initial impact of the Walmart marketplace expansion in the quarter. New competition entered the marketplace with some extremely aggressive price points, which, among others, includes a $6 fee and a zero-FX rate to Mexico. Against that backdrop, our focus has been on positioning our offering to ensure we retain our customers and transactions. While we were quite successful on this point and materially outperformed against our worst-case projections, given our need to match the aggressive competitive pricing, we did incur about a 65-basis point headwind on money transfer revenue growth in the quarter, of which the vast majority directly impacts EBITDA. Assuming competitor prices remain the same and considering a full quarter of impact, we anticipate about a 250-basis point impact on money transfer revenue from competitive Walmart pricing in the third quarter. We continue to actively manage this business and are actually pleased with our performance thus far. And since I know some of you will probably ask me later anyway, Walmart represented about 8% of revenue in the month of June.”
Money Gram Online
CEO Holmes continued to highlight its MoneyGram Online (MGO) as a primary growth driver, “Within MGO, our leading app continues to drive amazing growth, with a 92% year-over-year increase in cross-border transactions in the second quarter. As you can see from the chart on the right, our customer acquisition initiatives are driving strong growth in monthly active cross-border customers, which grew 54% in the second quarter compared to the same period last year. Turning to Slide 6. These growth rates are especially remarkable when you consider the record transactions that we delivered last year. With 85% of new MoneyGram Online customers new to the brand, our digital marketing initiatives are enabling us to reach a new and younger consumer segment. With over 80% customer retention rates and approximately 3x customer lifetime value compared to the retail channel, we're excited about the value we're creating and the ability to deliver sustained profitable growth.” He concluded, “We have a strong road map in the second half of the year to launch new wallet partners and enable over 20 new countries with the capability to send directly to a recipient's bank account through their debit card. Visa and their Visa Direct product remain a strong partner across these initiatives as we focus on country expansion and informing consumers about our real-time capabilities. In the quarter, our Visa Direct transactions hit new highs and also delivered over 230% year-over-year growth.”
MGI Opportunistic Pullback Levels
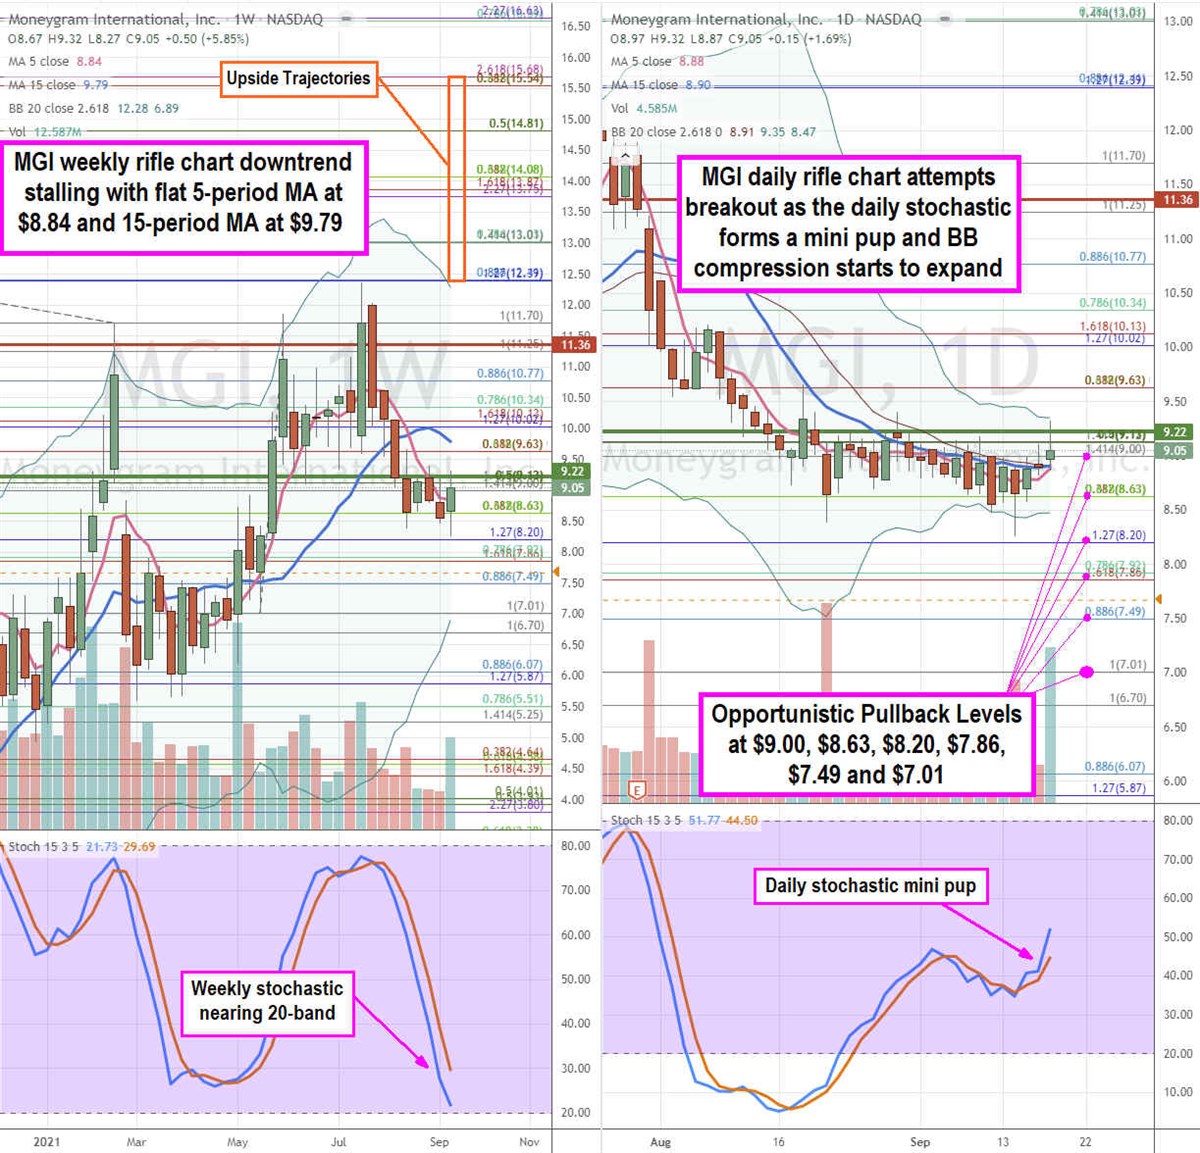
Using the rifle charts on the weekly and daily time frames provide a precise view of the price action playing field for MGI stock. The weekly rifle chart peaked off the $12.39 Fibonacci (fib) level before falling as low as $8.27 before staging a rally. The weekly rifle chart downtrend is stalling as the 5-period moving average (MA) flattens at $8.84. The weekly market structure low (MSL) buy triggers above $9.22 despite the weekly stochastic still falling towards the 20-band. The weekly upper Bollinger Bands (BBs) sit near the $12.39 fib. The daily rifle chart has been in compression as the daily BBs tightened to a $0.50 trading range before the daily stochastic crossed up and formed a mini pup. The daily 5-period MA is attempting to crossover the 15-period MA at $8.90 to trigger a breakout. The daily upper BBs at $9.35 will expand as the channel tightening formed to the weekly 15-period MA at $9.79. Prudent investors can watch for opportunistic pullbacks at the $9.00 fib, $8.63 fib, $8.20 fib, $7.86 fib, $7.49 fib, and the $7.01 fib. Upside trajectories range from the $12.37 fib up towards the $15.68 fib level.
Click the link below and we'll send you MarketBeat's guide to investing in electric vehicle technologies (EV) and which EV stocks show the most promise.
Get This Free Report