Teladoc Health (NASDAQ: TDOC) provides telemedicine services to over 12,000 clients including over 300 health systems accessing 27 million patients in over 130 countries worldwide. They cover over 450 medical specialties from urgent care to second opinion services connecting medical professionals with patients with frictionless video virtual appointments through mobile or desktop apps providing access and convenience in a cost-effective manner. Teladoc points out their second opinion services have resulted in 79-percent of treatments getting modified and 39-percent of surgeries were avoided. Shares have been on a tear as investors embrace the cost-efficiencies of telehealth which enables engagement through a non-touch platform especially in light of the coronavirus outbreak. Telemedicine is a favored bipartisan trend in an era of reining in healthcare costs without sacrificing quality care. The key question is whether the shares have gotten ahead of the fundamentals or setting up the next leg higher.
Earnings Catalyst
Teladoc reports Q4 2019 earnings post-market Feb. 26, 2020 followed by a 4:30 pm EST conference call. Consensus analyst estimates are for a loss of ($0.32) EPS on revenues of $153.06 million. The $600 million acquisition of InTouch Health, an integrated suite of healthcare technology products, sparked the grind to all-time highs in the 119s heading into the earnings. In the last earnings release, Teladoc raised FY 2019 guidance with revenues at $546 million to $550 million from $545 million and total visits ranging from 3.9 million to 4.1 million from the original range of 3.7 million to 4 million. The bar has been set high heading into the Q4 earnings release. The coronavirus outbreak has also contributed to the positive sentiment as touchless-remote virtual doctor visits are seen as a positive catalyst in the same vein as remote business engagements and meetings sparked new highs for shares of Zoom Video Technologies (NASDAQ: ZM) . TDOC shares have a 28.53-percent short interest on the float of 71.55 million shares making this on highly susceptible to a short-squeeze.
Rifle Chart Technical Analysis Trajectories: Longer-Term
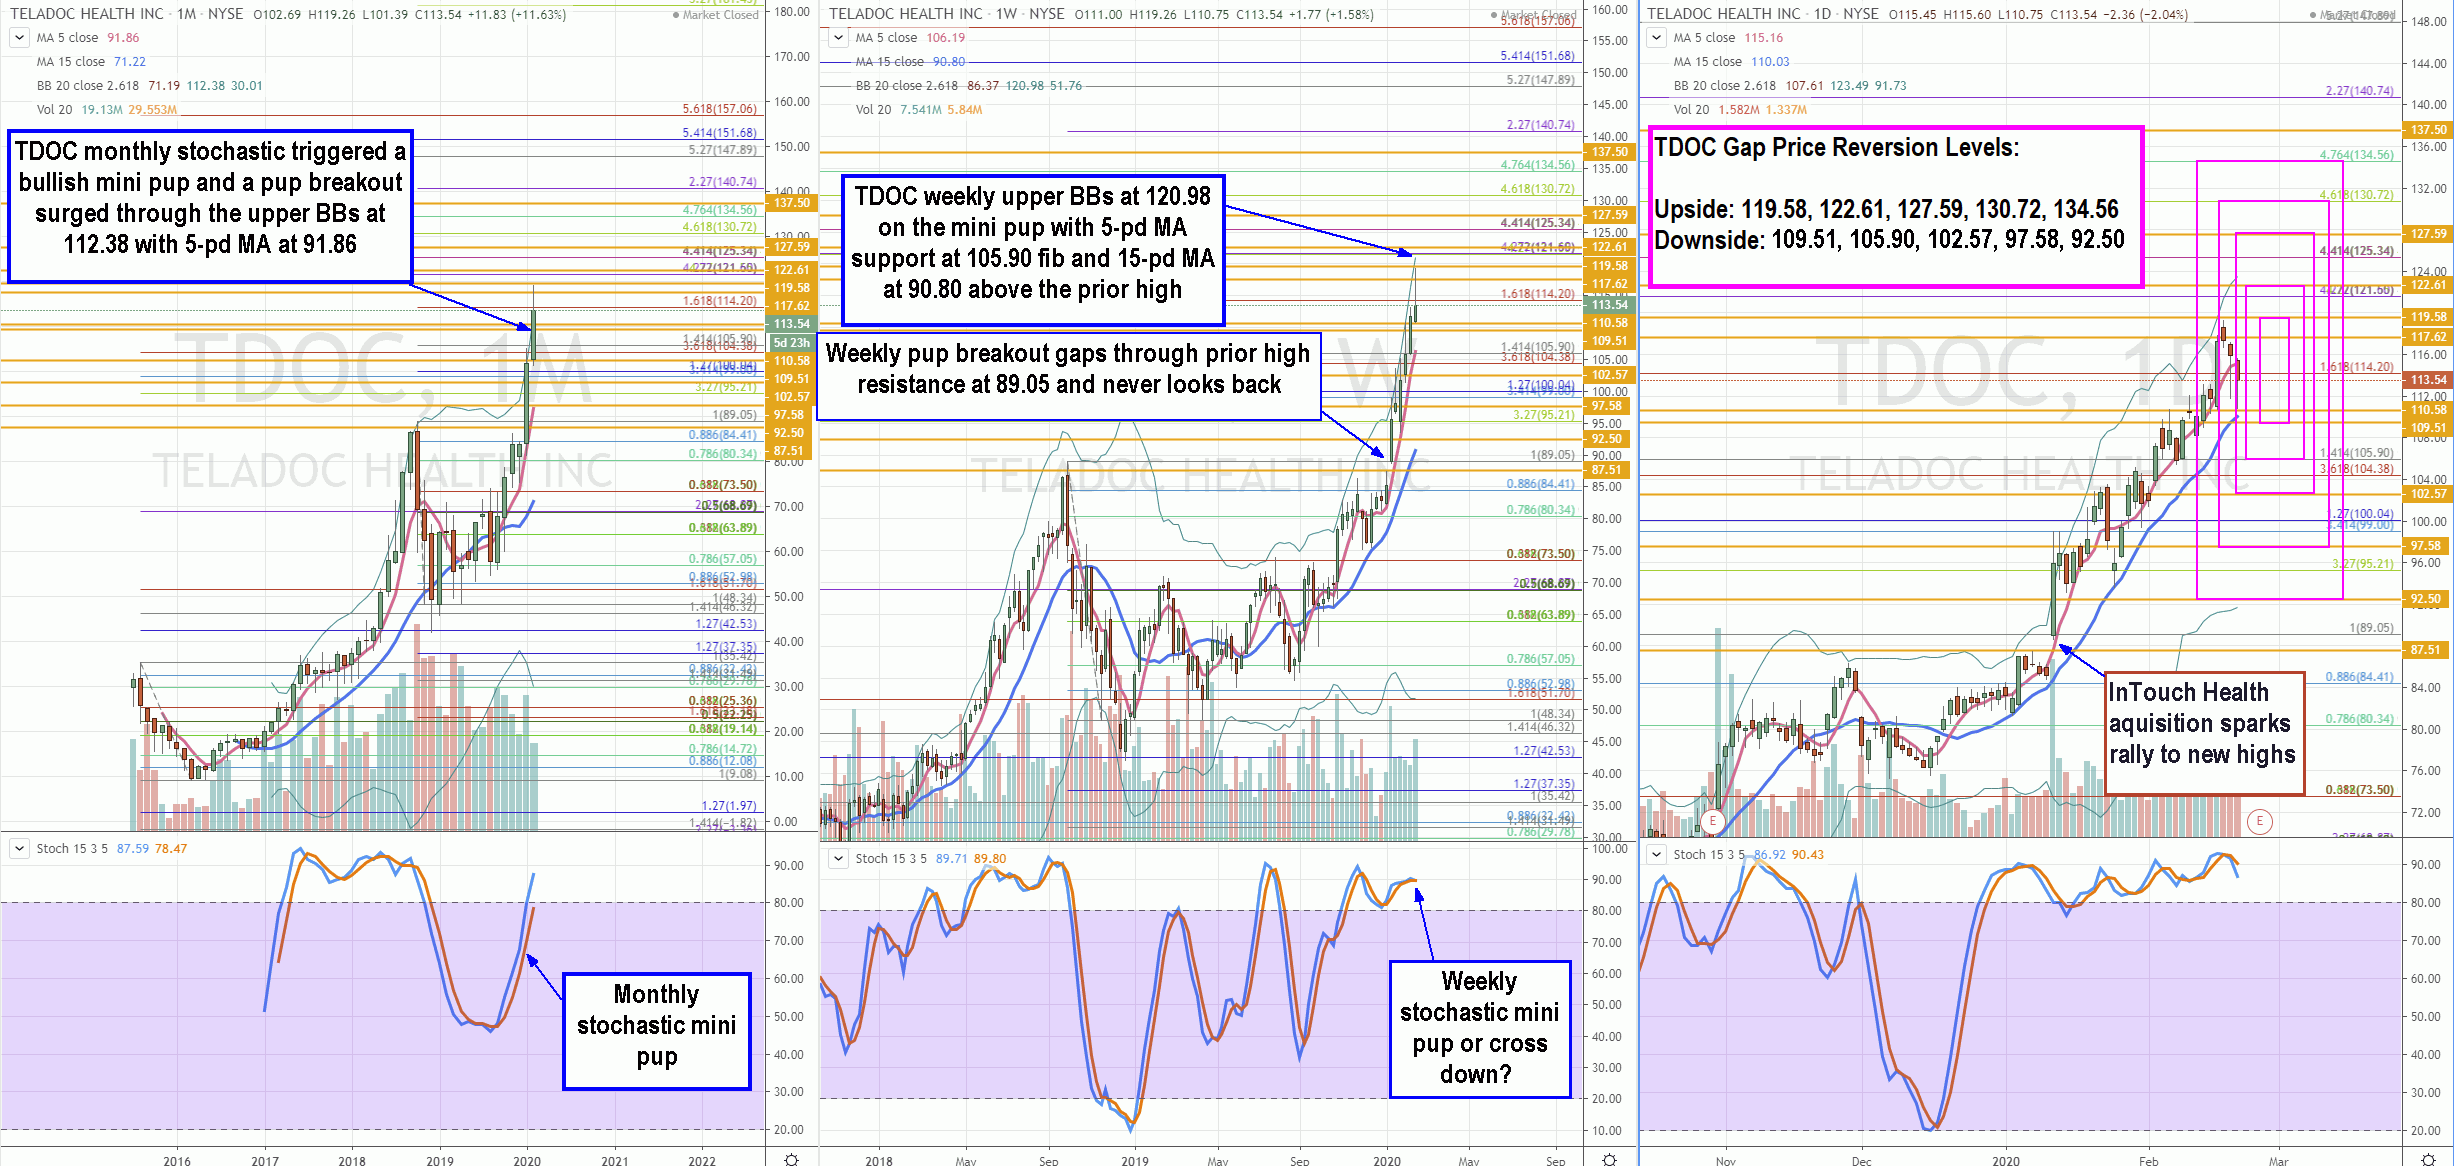
We use the rifle charts on wider time frames to lay out the playing field suitable for swing traders and investors. TDOC has had a wide trading range from 89.05 highs to 51.70, ultimately breaking the highs on a gap fueled by the InTouch Health acquisition. This triggered the monthly stochastic mini pup and weekly pup breakout surpassing the monthly upper Bollinger Bands (BBs) at 112.38 to peak out at 119.26. The monthly 5-period moving average (MA) support sits at 91.86 with the weekly 5-period MA support at the 105.90 Fibonacci (fib) level. The earnings reaction will determine if the weekly stochastic triggers a mini pup sending shares higher or a stochastic cross down triggering a weekly market structure high (MSH) sell trigger under the weekly 5-pd MA.
Sympathy Stocks:
Teladoc enables virtual meetings for medical purposes. Sympathy stocks providing virtual engagements may seem positive correlation especially in the current environment of the coronavirus epidemic. Some of these players include ZM and behavioral health services network Catasys Inc. (NASDAQ: CATS) .
Trading Game Plan for Earnings Gap:
This information is accommodative to intraday and short-term traders looking to play the earnings gap. TDOC reports Q4 2019 earnings Weds. Feb. 26, 2020, immediately after the close followed by a 4:30 pm EST conference call. Usually, optimism tends to build heading into the conference call when shares take a hard gap down. This applies best to 5:00 pm EST and 10:00 am EST conference calls. However, the TDOC conference call at 4:30 pm EST doesn’t leave much time for traders to react. Nimble post-market traders can scalp the price gap reversion levels, but most should wait for the morning session off the opening bell. Traders can expect scalps ranging from 0.50 to 1.25 in the first 20-minutes and shrink afterward. Reversion scalps off the key price inflections levels can be played for the second gap reaction then shift focus to the third reaction trend move. The gap price reversion levels for the upside price gaps are: 119.58 sticky 5s zone, 122.61 sticky 2.50s zone, 127.59 sticky 2.50s zone, 130.72 fib and 134.56 fib/sticky 2.50s zone. Downside gap reversion price levels are: 112.38 monthly upper BBs/sticky 2.50s, 109.51 sticky 5s zone, 105.90 fib, 102.57 sticky 2.50s zone, 97.58 sticky 2.50s zone and 92.50 sticky 2.50s zone. Traders can trade the in-between fibs and sticky 2.50s levels intraday as well.
Before you make your next trade, you'll want to hear this.
MarketBeat keeps track of Wall Street's top-rated and best performing research analysts and the stocks they recommend to their clients on a daily basis.
Our team has identified the five stocks that top analysts are quietly whispering to their clients to buy now before the broader market catches on... and none of the big name stocks were on the list.
They believe these five stocks are the five best companies for investors to buy now...
See The Five Stocks Here
Learn the basics of options trading and how to use them to boost returns and manage risk with this free report from MarketBeat. Click the link below to get your free copy.
Get This Free Report
Like this article? Share it with a colleague.
Link copied to clipboard.