
Who doesn’t like the idea of growth in their portfolio?
Certainly, for investors with a more aggressive bent, it’s a more appealing notion than “value.” Although the research of Eugene Fama and Kenneth French, which yielded the three-factor model, shows that value and small companies outperform the broader market over time, it’s true that domestic growth has trounced other asset classes in the past decade.
Whether growth or value outperforms in any given market cycle, you still need both in a balanced portfolio.
For those who want to add alpha through adding single stocks, there are some things to look for when evaluating a potential buy candidate.
Earnings & Sales Growth
Although I rely on technical indicators for buy and sell decisions, I also rely on a stock’s fundamentals when constructing a watch list. While metrics such as return on equity or price-to-book ratio can be helpful as secondary indicators, or when searching for a particular type of investment, the basics of sales and earnings growth will give you a lot of valuable information to start with.
Don’t mess around with companies showing declining earnings or sales. You want to see how these fundamentals look, relative to the previous year’s results.
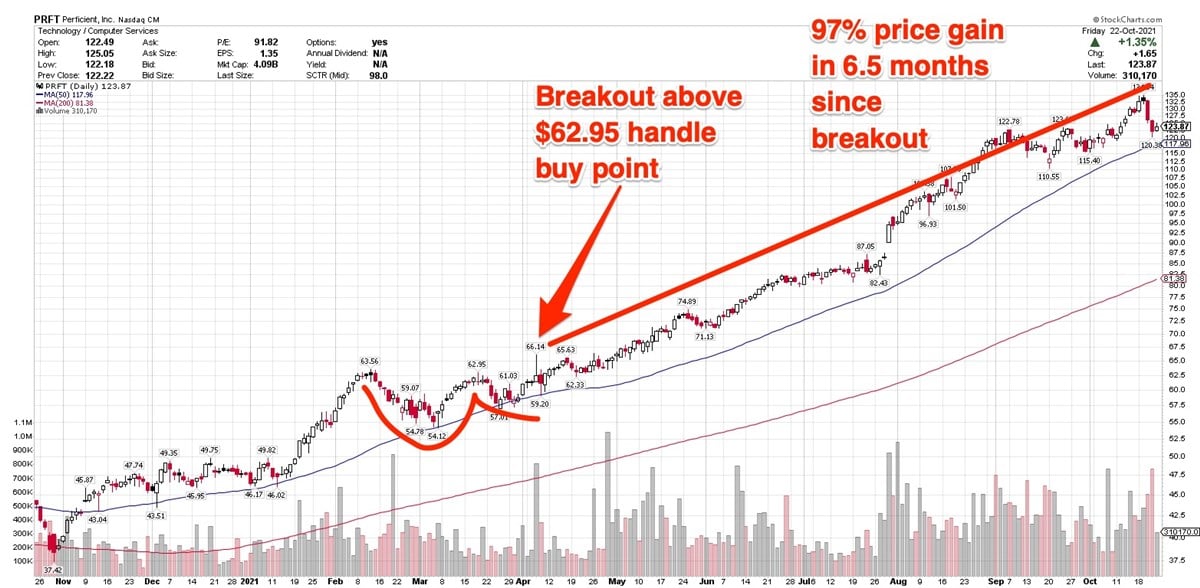
You want to see earnings per share and revenue growing at least 25% year-over-year. You can also look for accelerating revenue growth. For example, tech consultancy Perficient NASDAQ: PRFT grew revenue from 3% to 26% in the past four quarters, with increases each quarter. The company grew earnings from 10% to 47% in the past four quarters.
Institutional investors have research teams who look for these signs of strength. While algorithms certainly drive trading, professional asset managers still have teams of analysts who vet stocks for exactly these type of fundamental growth characteristics.
Understanding Chart Patterns
Chart patterns are a terrific way of tracking supply and demand in a stock. In particular, it will show you when big investors are selling shares, and when they are buying. Selling may be due to some profit-taking after a long run-up, or to bailing out after some type of bad news or sentiment affects the stock. That can be indirectly as an entire sector is under selling pressure, or directly, if the company itself has some specific bad or disappointing news.
Some common patterns include cup with handle, cup without handle, double bottom, flat base or wedge.
A proper chart pattern should be preceded by an earlier price run-up. That shows you that your stock has already been the subject of investment, and that institutions already spotted potential.
Patterns have the most utility for discretionary traders, or those who include some type of swing trading in their strategy. For portfolio diversification, it’s less relevant, although has some use when rebalancing a portfolio or investing money into an asset allocation strategy for the first time.
The key to using patterns to make buy decisions is to watch for heavy-volume breakouts. Not all work, but a breakout from a base, accompanied by heavy buying, may increase the chances of a successful run-up.
I’ve attached a chart of Perficient, with an example of a successful breakout from a cup-with-handle base.
Industry & Sector Strength
Birds of a feather flock together. A rising tide lifts all boats. You’re judged by the company you keep.
All these platitudes apply to the idea that the best stocks tend to hail from top-performing industries and sectors.
An easy recent example is the strength of domestic big techs in the pandemic era. As an asset class, those stocks were responsible for much of the gain in the S&P 500.
So let’s take our example of Perficient once again. The stock is part of the broader tech sector. As of this writing, its market cap is a bit north of $4 billion, placing it in mid-cap territory.
Drilling down, it’s part of the tech services sub-industry. Other components of that group, including TaskUs NASDAQ: TASK, Innodata NASDAQ: INOD, Grid Dynamics (NASDAQ; GDYN), Endava NYSE: DAVA, and EPAM Systems NYSE: EPAM are also showing price leadership.
That’s an excellent sign, as it means the services offered by stocks in the group are in high demand. That’s much better than taking a flier on a stock from a downtrodden industry that big investors are shunning. That’s often why we see strong sector performance: More than one stock is showing strong advances, attracting investor dollars.
Before you consider TaskUs, you'll want to hear this.
MarketBeat keeps track of Wall Street's top-rated and best performing research analysts and the stocks they recommend to their clients on a daily basis. MarketBeat has identified the five stocks that top analysts are quietly whispering to their clients to buy now before the broader market catches on... and TaskUs wasn't on the list.
While TaskUs currently has a "Hold" rating among analysts, top-rated analysts believe these five stocks are better buys.
View The Five Stocks Here
With average gains of 150% since the start of 2023, now is the time to give these stocks a look and pump up your 2024 portfolio.
Get This Free Report